Used Zammad version: 5.3.0-1671105844.50103cfd.centos7
Used Zammad installation type: RPM from repository
Operating system: Linux (CentOS 7)
Browser + version: Firefox, Chrome (various versions on various OSes)
Problem Description:
Since a few Zammad updates, Zammad web UI actions are slow. It can take up to 5 to 15 (or more) seconds for simple ticket updates like owner or state changes or email replies to become active and updated in the browser. It’s not a browser or connectivity issue and the problem didn’t happen until “a while ago”. In hindsight we cannot say, when exactly the delays started, but it does hinder us to work “fluently” with Zammad. There are just five agents working with Zammad and no end users on the web UI. The server is a VM with 4 vCPUs and 15 GB RAM:
On the server side I can see one or two process(es) script/background-worker.rb start, which at times massively occupy up to two (virtual) CPUs (up to 100%). I haven’t noticed such a process (or such a behaviour of this process) in the past. In the forum I found Zammad 5.2 extremely slow since update from 5.0 and After updateing to 5.2.0 version Zammad works very slow) which are maybe/probably related to this problem.
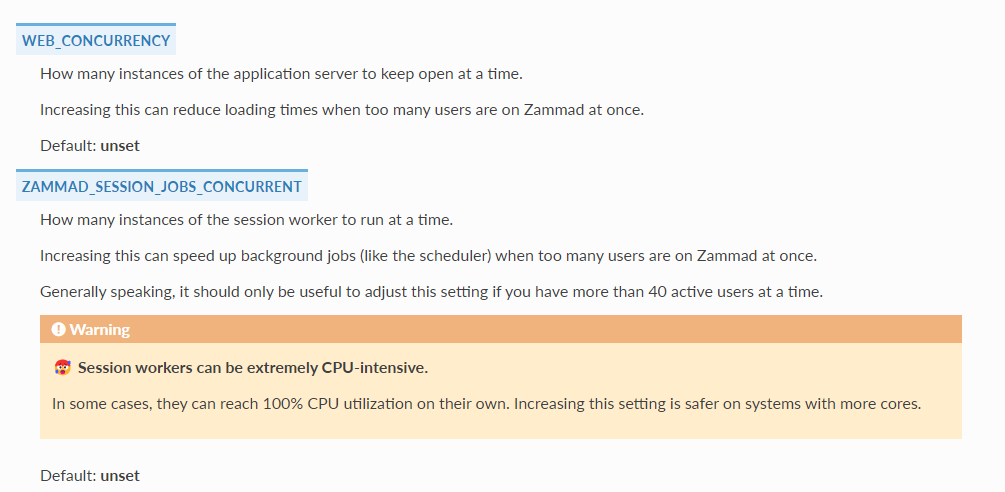
In an attempt to follow MrGeneration’s suggestion to not blindly change Zammad settings, I read through Configuration via Environment Variables — Zammad documentation, but w/o further information or documentation I cannot assess, how and where these variables influence Zammad’s performance. Also it is unclear to me, what a default of “unset” means. E.g. related to WEB_CONCURRENCY: Are there one, or two, or 10 instances of the application server running? Or is the number of running application servers dynamically adapted and if yes, how?
So in the end I guess, the main question is, what would be the best (or a good) way to troubleshoot these delays and to find the source of them
Thank you for the link related to the unprocessable mails @Stubenhocker. Unfortunately we don’t keep the mails in the inbox and so it is not trivial to reprocess them. However they are all quite old and I will probably simply delete them after having inspected the contents manually.
Thanks for the interesting link @dvanzuijlekom. In our case WEB_CONCURRENCY and ZAMMAD_SESSION_JOBS_CONCURRENT are empty/unset. Unfortunately the documentation doesn’t explain, what that means and how the system behaves when the settings are undefined. So I am basically in a similar situation as @fitzy89 (but there are not database locks as far as I can say and we are using MariaDB, not PG). In the end I am nevertheless forced to more or less blindly set WEB_CONCURRENCY and ZAMMAD_SESSION_JOBS_CONCURRENT to see what effects it has on the “felt” performance in the UI…
We clearly state that this highly depends on your load. WEB_CONCURRENCY affects loading speeds and ZAMMAD_SESSION_JOBS_CONCURRENT is basically only relevant when you have piling background jobs in combination with slowly or no refreshing overviews.
Setting WEB_CONCURRENCY and ZAMMAD_SESSION_JOBS_CONCURRENT both to 4 seems to have slightly improved the situation (VM with 4 vCPUs, 16 GB RAM and never more than 4 or 5 agents working on it. No customer activties in the UI). I will observe it for a while
as I have mentioned in the previous posts, it is mainly an explanation, what an unset value (as it is per default) means. E.g. for WEB_CONCURRENCY: Is there no concurrency at all (which imho would be a default of 0)? Or is there some dynamically set concurrency value? The same applies to ZAMMAD_SESSION_JOBS_CONCURRENT. And if it is a dynamically set configuration, how can I see the currently valid value? That might give me a feeling, in which direction I should change the settings.
For the time being we will have a look at 4/4, but the subjective UI reactiveness has decreased considerably since a few updates and in the first place I am looking for troubleshooting tips (see the title of this thread and only in the second place, for “pfannenfertige” Solutions (although I would take them, if they work )
Not sure, what a “member of an organization” is, but we are six active agents, two organizations and, yes, quite a lot of customers (I’d guess 50-100, I would not know how to count them). However to my knowledge, only two or three customers use the web UI. With all others, contact is done exclusively via mail. There are around 10 overviews (open/all/subscribed/pending reminder/pending reached per user, open/all/pending reached per organization and some specials)
Waiting for Zammad to e.g. open or update a ticket is most often an issue with your web concurrency.
If that’s not it your I/O may be an issue but that’s hard to tell.
Generally the issues you describe combined with the numbers you’re providing don’t exactly add up. Even untuned this shouldn’t be such a big issue. So the question would be what changed -apart- from the Zammad version due to an update.
Also make sure that your websockets work as this might be an issue loading your application server without any real use.
We had some overviews with a lot of entries that where calculated by a lot of values. Very complicated stuff that we did not really need, but forgot them there.
Removing them drastically increased the whole performance of zammad for us.
I think that the count of tickets in the overviews decrease the performance even if you dont have the overviews open, as it seems that a lot more the complexity of the conditions they are calculated do.
Also, you can reindex elasticsearch and configure it not to index large files, pdf files and so on.
Thanks for your thoughts @bur, but our overviews are pretty basic with very few filters (all open and unassigned, my open, my pending, my pending reached, open/all per group and two overviews listing the tickets belonging to two specific agents). Also we didn’t have any performance issues before 5.0 or 5.2 (in hindsight we cannot tell exactly, which update introduced the performance issues). But of course in the end each ticket appears in at least one overview.
I don’t exclude some database issue, but we are using MariaDB (not PostgreSQL) and databases are not my speciality (to say the least), so I would not know how to troubleshoot the database part of Zammad.
I will however check, how I can run an ES reindexing. Thanks for this hint.
postGreSQL in our learnings is a significant performance factor against MariaDB. I’d switch it if I were you. (You’ll have to do until Zammad 7 anyway).