I saw on the zammad.com page there is an integration with Grafana, which seems really cool.
However i’ve been searching but i couldn’t really find template dashboard’s, which could be used as a starting point. Are there any predefined dashboard’s available or even a couple of usefull queries to start from? Also i wonder if there is some documentation available?
What i currently understand is that you have to connect grafana to the elasticsearch instance and not the database?
Thank you for your reply.
For people looking for a starting point, zammad creates these indexes;
zammad_production_stats_store
zammad_production_knowledge_base_translation
zammad_production_organization
zammad_production_ticket
zammad_production_knowledge_base_category_translation
zammad_production_user
zammad_production_knowledge_base_answer_translation
zammad_production_cti_log
probably the most useful starting point is this configuration;
I found that most queries are actually much simpler directly on the database, instead of on ES. Since grafana doesn’t support script queries on ES. The disadvantage is that the state is changed in the database, so you can’t get historical stats, which i believe you could get from ES. Currently i don’t have a cohesive dashboard, and lack a bit of inspiration on, what kind of dashboards would be nice. We also started using zammad since a couple of weeks. So if you have idea’s please post them.
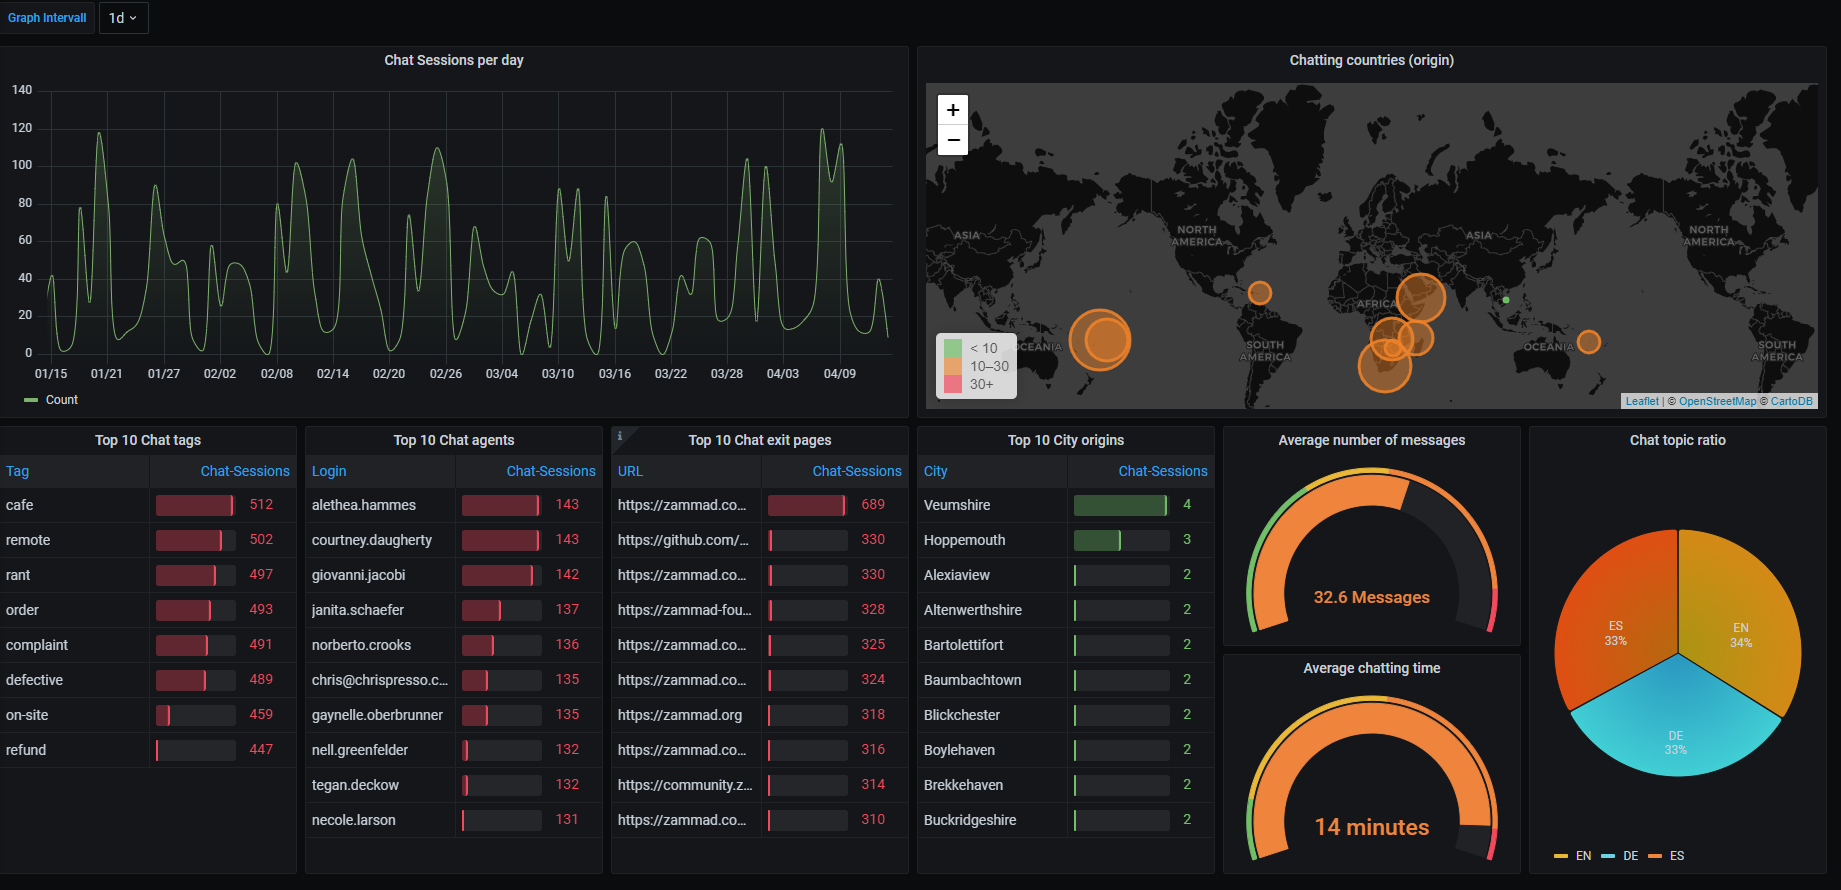
see below some of my trials in a dashboard, it expects 2 datasources, zammad (connecting to ES) and zammad-db (connecting to the postgres database);
@olafbuitelaar Thank you for sharing. Yes I noticed the issues with the historical data and thus the need for using a combination of DB and ES, if not only the use of ES.
I am going work with this for a few days as I have an immediate need for getting Zammad ticket data e.g. agent performance, open/closed, SLA exceeded tickets etc in to place.