Infos:
- Used Zammad version: V4.0
- Used Zammad installation type: (source, package, docker-compose, …): package
- Operating system: centos7
- Browser + version: chrome/firfox
Expected behavior:
- I want to connect my zammad instance to grafana
Actual behavior:
- I dont know how to configure grafana with the right parameters
->zammad and grafana are installed on different VM on the same private network
on zammad VM :
# curl http://localhost:9200
{
  "name" : "helpdesk.xxx.xx",
  "cluster_name" : "elasticsearch",
  "cluster_uuid" : "yyyyyyyyyyyyyyyy",
  "version" : {
    "number" : "7.6.2",
    "build_flavor" : "default",
    "build_type" : "rpm",
    "build_hash" : "dfg8eb548236666466ggddtaabd087olhtngf",
    "build_date" : "2020-01-26T06:34:37.853214A",
    "build_snapshot" : false,
    "lucene_version" : "8.4.0",
    "minimum_wire_compatibility_version" : "6.8.0",
    "minimum_index_compatibility_version" : "6.0.0-beta1"
  },
  "tagline" : "You Know, for Search"
}
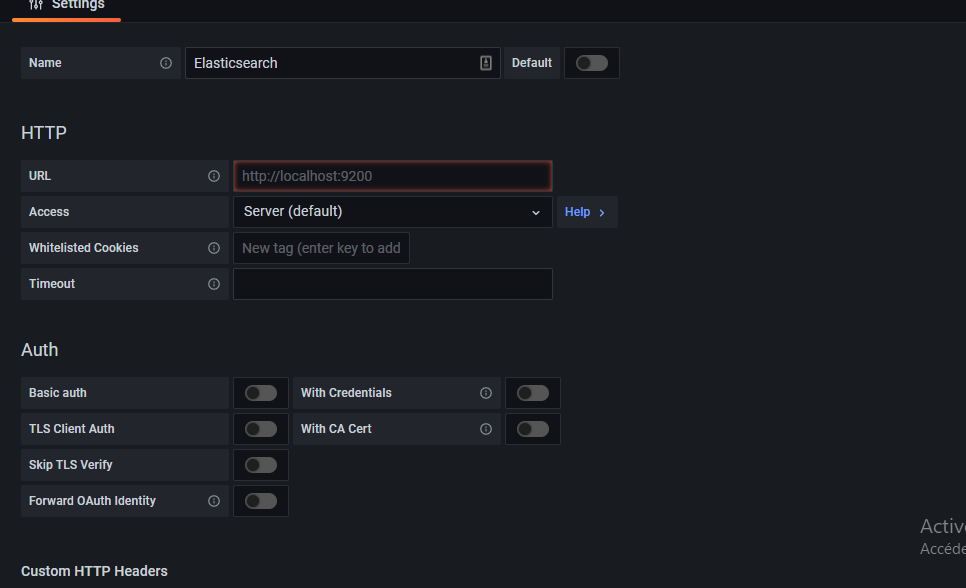
How to configure grafana datasource? I couldnt found clear documentation with steps , just this ticket helped me Grafana dashboards - #2 by MrGeneration
->I can’t put http://localhost:9200 because its on another server
→ I have tried http://helpdesk.xxx.xx:9200