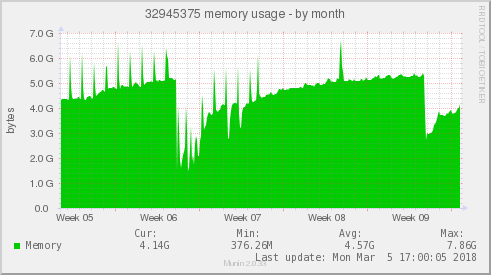
Memory usage is always increasing until i restart zammad (elasticsearch is not installed)
Is it normal? Only zammad is running on this server (4x2000MHz, 8Gb RAM)
12643 tickets, 3283 users, 19 operators works with zammad
Hmm Zammad thems to be a bit hungry 
Could you try to set those values in your environment (make sure they survive a reboot)
export RUBY_GC_MALLOC_LIMIT=1077216 RUBY_GC_MALLOC_LIMIT_MAX=2177216 RUBY_GC_OLDMALLOC_LIMIT=3000100 RUBY_GC_OLDMALLOC_LIMIT_MAX=4000100
This tells the ruby garbage collector to clean up more often, within the given limits in bytes.
P.S.
Which Zammad version do you use?
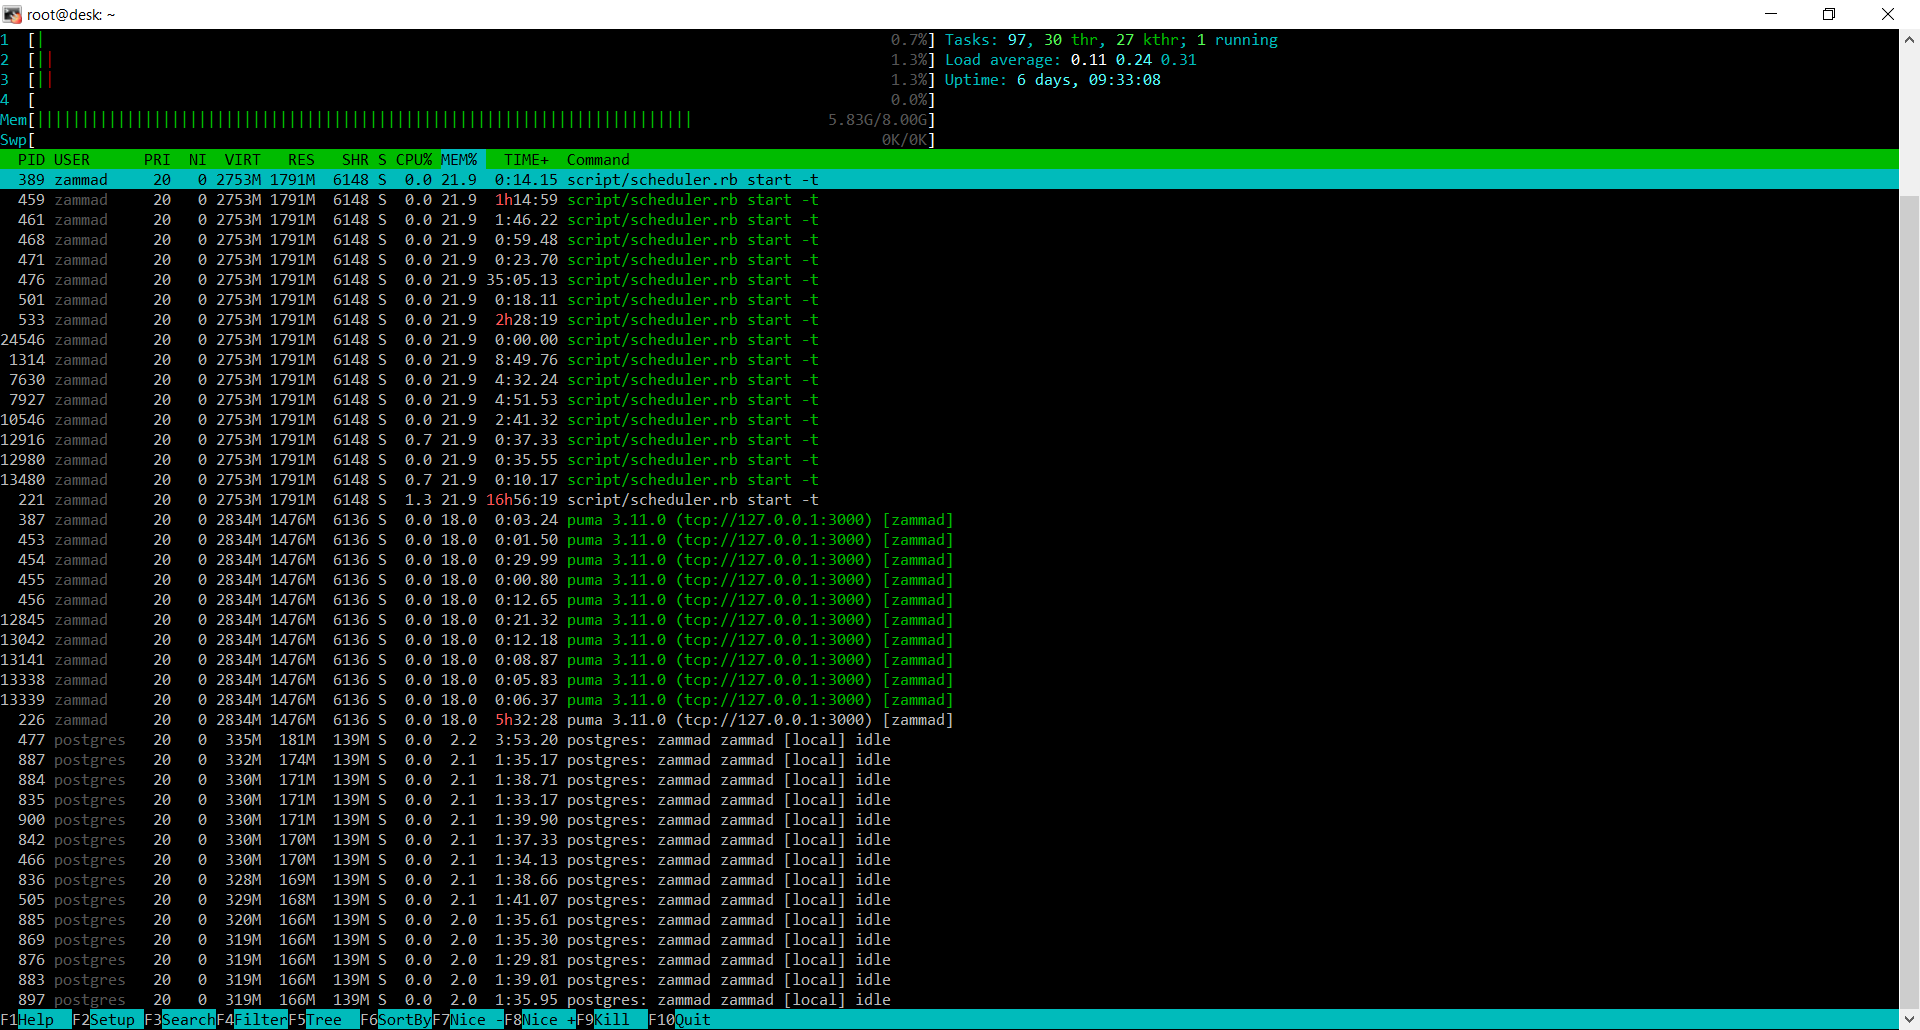
could you provide a top / htop output sorted by memory consumption?
regards
Johannes
1 Like
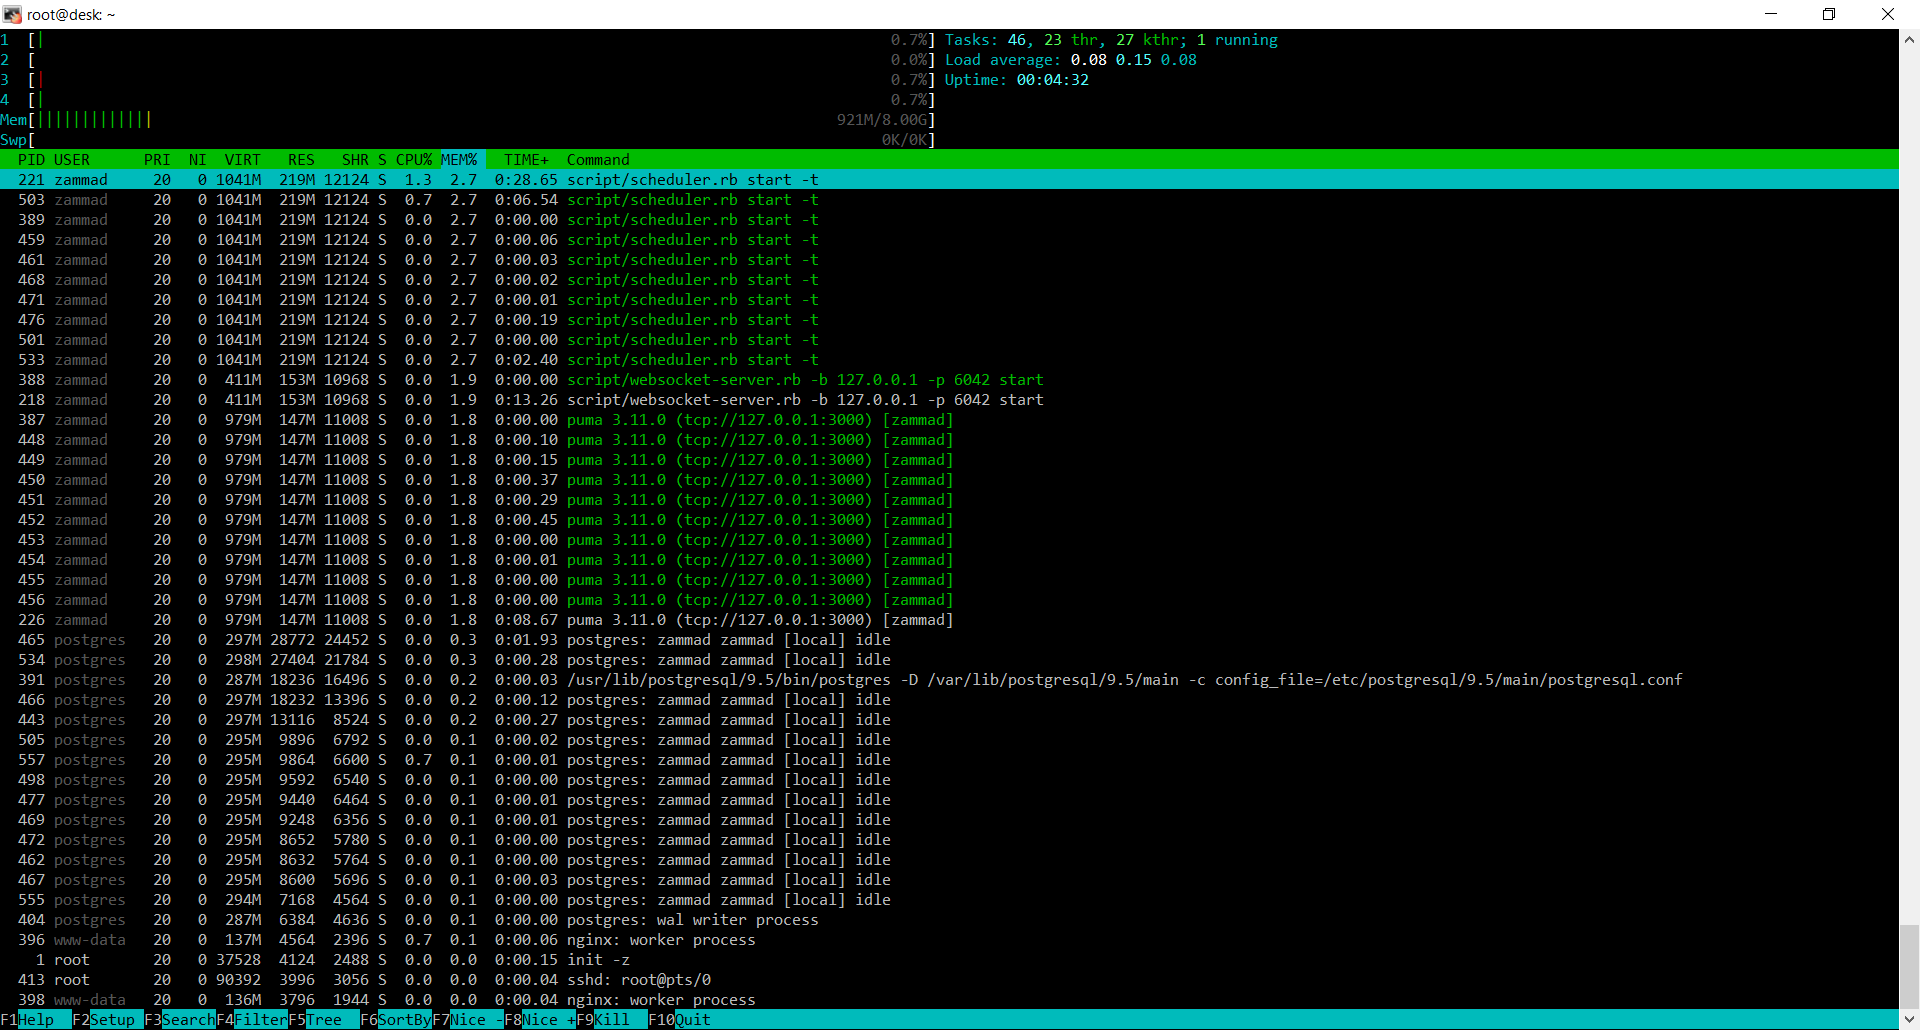
Is the memory still increasing so hard?
@anon29869905 do you have an idea why the scheduler is consuming this much memory? And why there are so many processes?
We did some changes for Zammad 2.4 regarding the memory footprint:
In heavy production environments puma used 1,2GB after 5 days. Now puma only takes 800-900 MB. This will probably have positive effects on the Scheduler, too.
I don’t understand why there are so many Schedulers running. Looks wrong to me. 1 GB RAM for the Scheduler is not that bad under current circumstances.
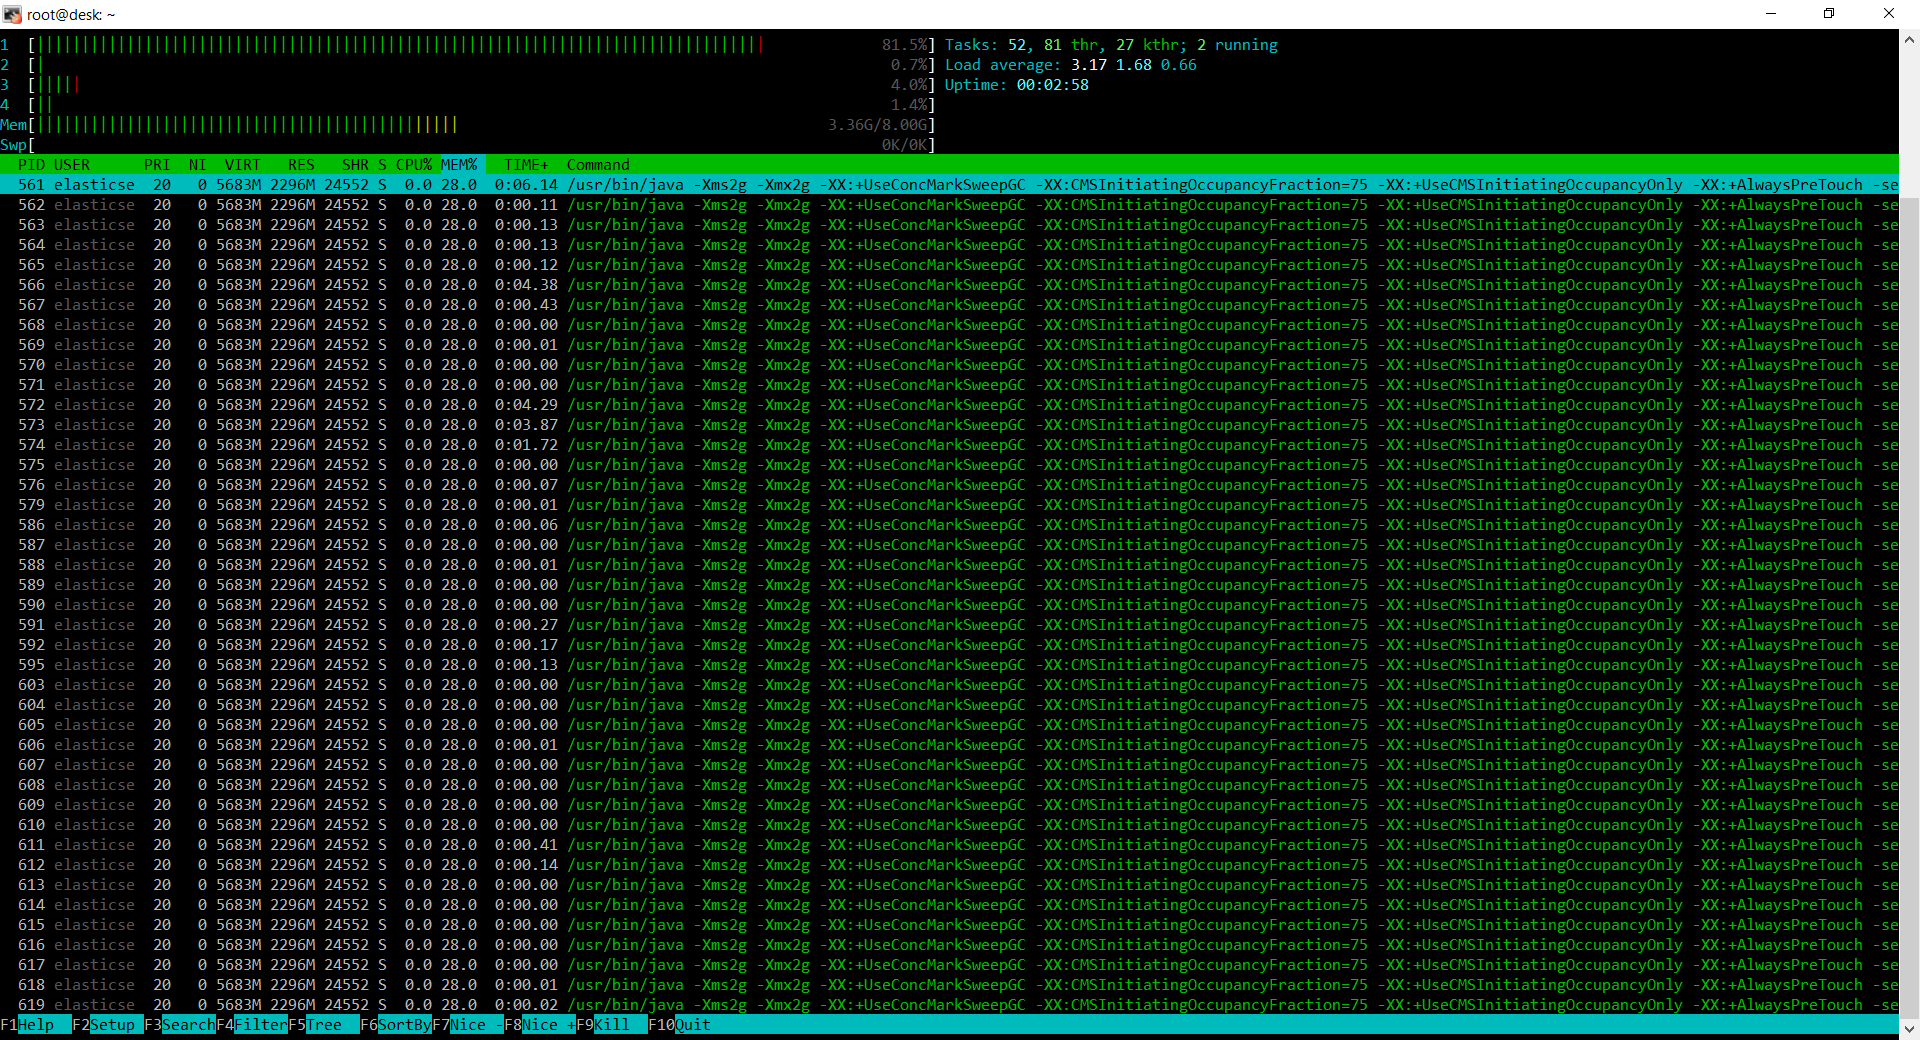
With Elasticsearch enabled it has even more memory consumption immediately after restart:
Maybe the problem is that DB has size 60Gb already?
Hi @slavian87 - how many concurrent users (agents and customers) work in your Zammad simultaneously at peak time?
Our recommendation for 10 concurrent users and a smooth user experience is:
- 6 CPUs
- 12 GB RAM (because of the hungry ES)
- Put
/opt/zammad/tmpinto a RAM-Disk (2-3 GB, keep an eye on it and extend if required)
For the application server:
https://docs.zammad.org/en/latest/appendix-configure-env-vars.html ->
zammad config:set WEB_CONCURRENCY=3
systemctl restart zammad
One scheduler instance is sufficient
To reduce the memory load of the Ruby processes you can set the Ruby specific ENV vars (as described above):
export RUBY_GC_MALLOC_LIMIT=1077216 RUBY_GC_MALLOC_LIMIT_MAX=2177216 RUBY_GC_OLDMALLOC_LIMIT=3000100 RUBY_GC_OLDMALLOC_LIMIT_MAX=4000100
Not above 10 concurrent users. I don’t have any problems with speed and smooth. I just want to understand is it normal or not. After installation of ElasticSearch and successful “zammad run rake searchindex:rebuild” (it took 1h 50m) i’ve got the problem with search:
- the Overview for state is closed shows 13160 tickets
- search for state:closed shows 50 tickets
So if your Zammad does not require more resources than in our recommendation it is “normal”. As stated earlier Zammad 2.4 will increase the overall performance and reduce the memory load. Especially in systems with a lot of tickets.
Regarding the limit of 50 search entries see https://github.com/zammad/zammad/issues/1744
This topic was automatically closed 30 days after the last reply. New replies are no longer allowed.