Used Zammad installation type: (source, package, docker-compose, …) : package on Ubuntu 20.04
Operating system: macOS Catalina 10.15.7
Browser + version: Google Chrome Version Version 117.0.5938.149
Number of staff using Zammad : 40
Number of emails received and sent per day : 300 to 400
Expected behavior:
Background jobs that concern emails should be processed within approximately 10 to 30 minutes in Zammad
Actual behavior:
We are facing a large number of background jobs in queue which are being processed very slowly since 2 days and the emails are no longer been sent
Steps to reproduce the behavior:
Update multiple articles in different tickets in a very short period of time. This creates a number of Background jobs.
Send emails via zammad
Result: Emails do not go out until the other background jobs are completed.
Do you think that we can see somewhere (with which command?) the list of the background jobs queued? Can we use a command to priorize the sending emails jobs (Which command)? Can we do something to get a faster process with background jobs?
Thanks Mr Generation for your answer.
Yes we inslall it 2 years ago.
We are going to perform these updates during non working days at the end of this week. but is there a chance to solve our problem or to have informations about priorizing email send backgroud jobs before that?
Hi MrGeneration, We have finnaly proceed with this update last night. We are now with this configuration :
Used Zammad version: 6.1.
Used Zammad installation type: (source, package, docker-compose, …) : package on Ubuntu 20.04
Operating system: macOS Catalina 10.15.7
Browser + version: Google Chrome Version Version 117.0.5938.149
Number of staff using Zammad : 40
Number of emails received and sent per day : 300 to 400
We are facing a these issues :
The supervision system is now saying :
Channel: Email::Account in is active but not fetched for about 7 hours - We have tested the email connection and every things work fine. Zammad is saying that he found x emails and that he will download them to zammad, but nothing happened.
We still have 14532 background jobs in queue processed very slowly.
scheduler may not run (last execution of Stats.generate 20 minutes ago) - please contact your system administrator
Can we have a list oft these backgroud jobs and priorize emails jobs (Sending and receiving emails is the most important think we need to solve)?
You will probably want to look into performance tuning of your instance. You might want to (temporarily?) raise the hardware capacity of your machine/VM to process the huge backlog of jobs.
Keep an eye on the performance of the machine and check if you are experiencing bottlenecks other than Zammad itself (e.g. disk latency, CPU/memory usage).
Hi dvanzuijlekom,
Thanks for your answer!
We have already change those environnement Variables :
ZAMMAD_PROCESS_DELAYED_JOBS_WORKERS is set to 16
WEB_CONCURRENCY is set to 8
ZAMMAD_SESSION_JOBS_CONCURRENT is set to 8
Our Server has 20 cores with 80Go Ram. We didn’t see any perfornance problem on the server. The CPU usage is very low (6%).
Any other ideas? We just want to know if we can list those jobs and if we can do something to proorize our emails, because we have some of them waiting since 2 days…
That’s some big numbers for just 20 cores.
You’re theoretically overloading the host, because your performance tunings alone require 32 core alone if they go full 100% usage.
Also note that if Zammad claims that it didn’t fetch for 7 hours + - then your background worker most likely is dead for whatever reason. Double check on that and restart zammad-worker and check on it.
OK, Thanks. We have lower the numbers like this :
ZAMMAD_PROCESS_DELAYED_JOBS_WORKERS is set to 8
WEB_CONCURRENCY is set to 6
ZAMMAD_SESSION_JOBS_CONCURRENT is set to 6
We have also restarted background worker. The message disappeared from Supervision tab but the emails are not coming into Zammad.
Concerning PostgreSQL Database, the config file shows that max_connections is set to 300. Do I have to increase that?
Just to share the last informations from production.log :
GNU nano 4.8 /var/log/zammad/production.log
I, [2023-10-12T00:04:30.671629 #290992-47137931778480] INFO – : Setting.set(‘models_searchable’, [“Chat::Session”, “Ticket”, “KnowledgeBase::Answer::Translation”, “Organization”, “User”])
I, [2023-10-12T00:04:30.690980 #291003-47311419947420] INFO – : Setting.set(‘models_searchable’, [“Chat::Session”, “Ticket”, “KnowledgeBase::Answer::Translation”, “Organization”, “User”])
I, [2023-10-12T00:04:30.699921 #291009-46997840492960] INFO – : Setting.set(‘models_searchable’, [“Chat::Session”, “Ticket”, “KnowledgeBase::Answer::Translation”, “Organization”, “User”])
I, [2023-10-12T00:04:31.886557 #291009-46997840492960] INFO – : Scheduler started.
I, [2023-10-12T00:04:31.899362 #291009-46997840492960] INFO – : Cleanup of left over locked delayed jobs 2023-10-12 00:04:31 UTC started.
I, [2023-10-12T00:04:31.929688 #291009-46997840492960] INFO – : Checking left over delayed job #<Delayed::Backend::ActiveRecord::Job id: 36045563, priority: 200, attempts: 0, handler: “— !ruby/object:ActiveJob::QueueAdapters::Delayed…”>
W, [2023-10-12T00:04:31.934816 #291009-46997840492960] WARN – : Destroyed locked delayed job: TransactionJob [ee8235bd-394e-4463-bf2e-7d24e0a73552] from DelayedJob(default) with arguments: [{“object”=>“Ticket”, “object_id”=>36288, "user_id>
I, [2023-10-12T00:04:31.934858 #291009-46997840492960] INFO – : Checking left over delayed job #<Delayed::Backend::ActiveRecord::Job id: 36045563, priority: 200, attempts: 0, handler: “— !ruby/object:ActiveJob::QueueAdapters::Delayed…”>
I, [2023-10-12T00:04:31.934874 #291009-46997840492960] INFO – : Cleanup of left over locked delayed jobs 2023-10-12 00:04:31 UTC finished.
I, [2023-10-12T00:04:31.934899 #291009-46997840492960] INFO – : Cleanup of left over import jobs 2023-10-12 00:04:31 UTC started.
I, [2023-10-12T00:04:31.935954 #291009-46997840492960] INFO – : Cleanup of left over import jobs 2023-10-12 00:04:31 UTC finished.
I, [2023-10-12T00:04:31.936091 #291009-46997840492960] INFO – : Scheduler running…
I, [2023-10-12T00:04:31.962174 #291009-46997905439220] INFO – : execute Ticket.process_pending (try_count 0)…
I, [2023-10-12T00:04:31.971246 #291009-46997905439220] INFO – : ended Ticket.process_pending took: 0.023433465 seconds.
I, [2023-10-12T00:04:32.097855 #291118-47138006120060] INFO – : Started GET “/api/v1/monitoring/health_check?=1697067711728" for 91.182.234.172 at 2023-10-12 00:04:32 +0000
I, [2023-10-12T00:04:32.126517 #291118-47138006120060] INFO – : Processing by MonitoringController#health_check as JSON
I, [2023-10-12T00:04:32.126575 #291118-47138006120060] INFO – : Parameters: {"”=>“1697067711728”}
It seems that since 4:30 AM nothing happened in the system.
I’m currently unable to help you in a proper time frame due to customer requests I am sorry.
If you need commercial grade support, you may want to consider a support contract for your process critical installation.
You should really be seeing lots of continuous activity in your production.log, as background jobs should be processed and lots of schedules run automatically. If they don’t, your background worker probably isn’t running, as MrGeneration stated earlier.
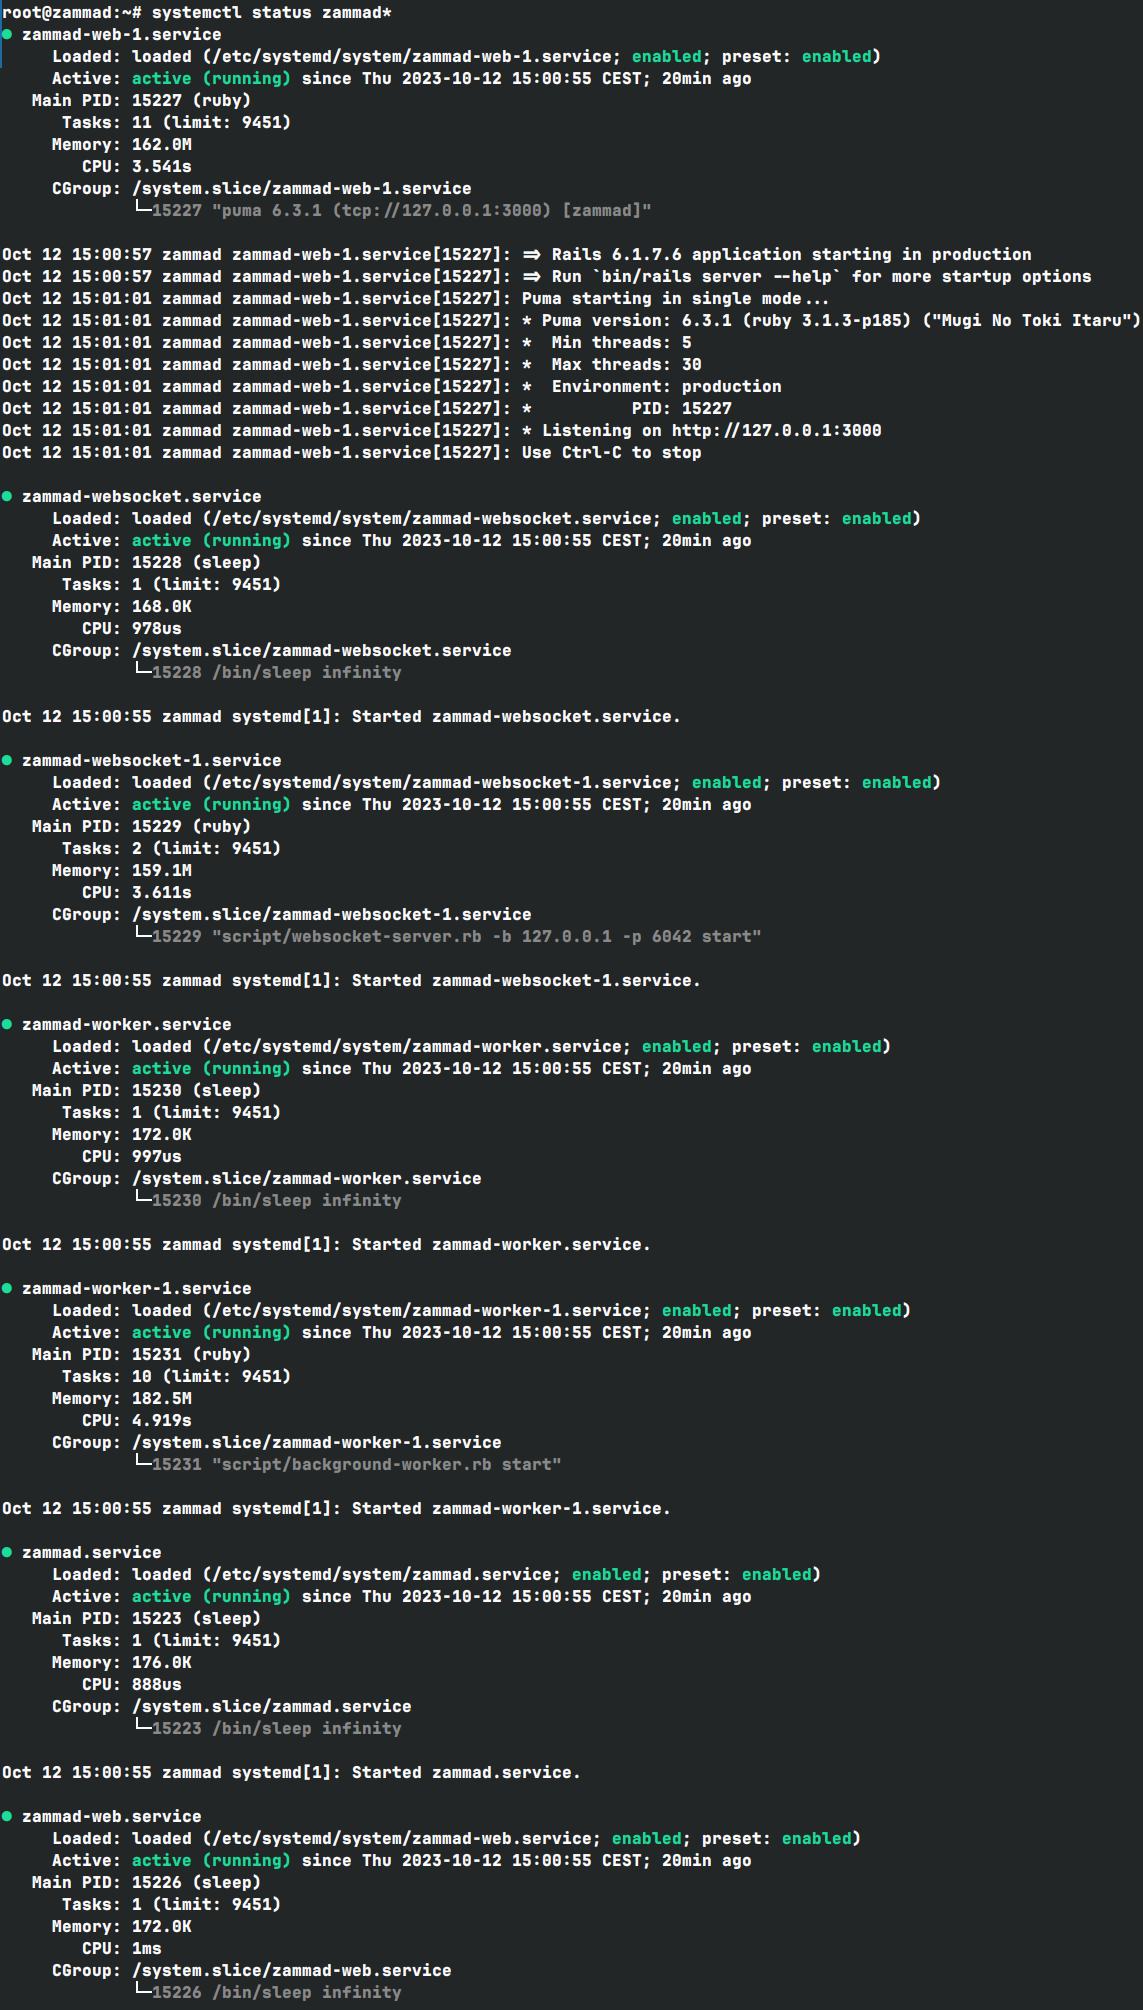
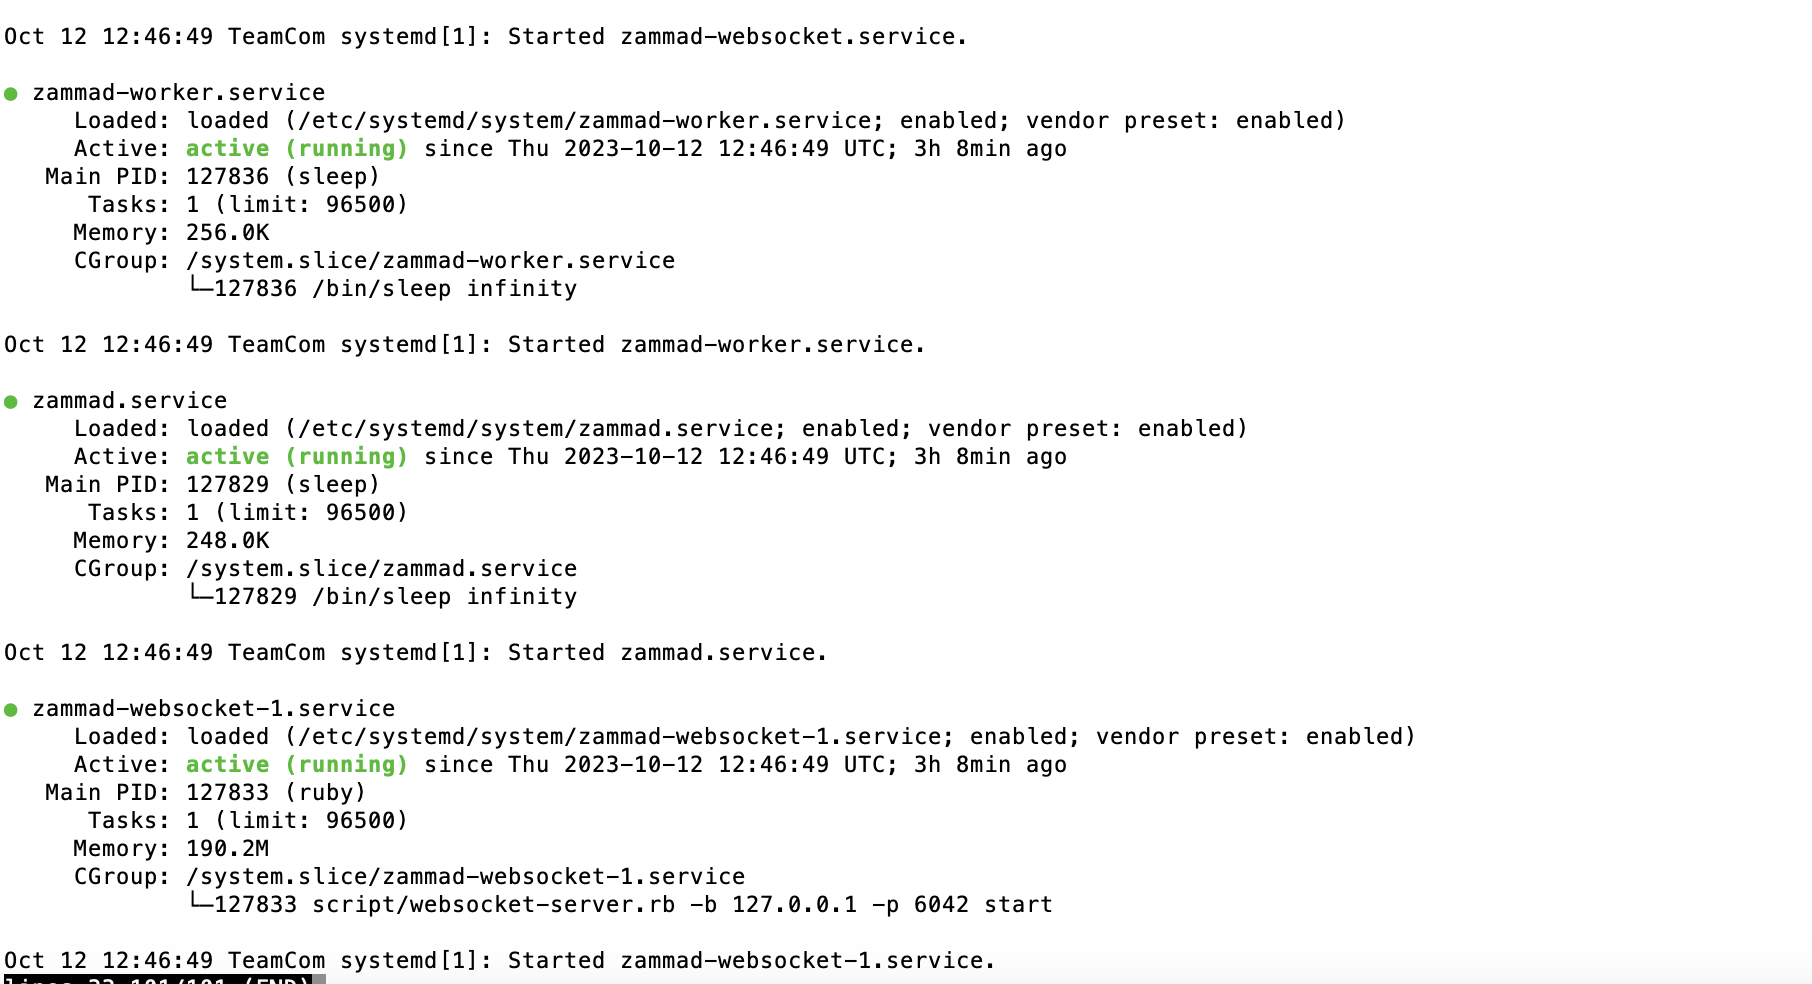
Maybe start by checking the status of individual Zammad components: systemctl status zammad*
And maybe check Apache or NginX as well, depending on what you’re running.
This is a (short) example of an active production.log:
root@zammad:~# tail -f /var/log/zammad/production.log
I, [2023-10-12T14:56:24.952606#14867-64680]  INFO -- : ProcessScheduledJobs running...
I, [2023-10-12T14:56:24.954140#14867-64680]  INFO -- : Running job thread for 'Generate 'Session' data.' (Sessions.jobs) status is: sleep
I, [2023-10-12T14:56:24.954337#14867-64680]  INFO -- : Running job thread for 'Check channels.' (Channel.fetch) status is: sleep
I, [2023-10-12T14:56:24.954461#14867-64680]  INFO -- : Running job thread for 'Check 'Channel' streams.' (Channel.stream) status is: sleep
I, [2023-10-12T14:56:24.954583#14867-64680]  INFO -- : Running job thread for 'Process ticket escalations.' (Ticket.process_escalation) status is: sleep
I, [2023-10-12T14:56:24.954979#14867-64680]  INFO -- : Running job thread for 'Execute planned jobs.' (Job.run) status is: sleep
If you’re not seeing any activity here, even when restarting Zammad, maybe check if your logging partition/disk isn’t full?
Check for errors up to the point things started going wrong, e.g: grep ERROR production.log or in one of the rotated logfiles. Maybe you’ll find clues.
Maybe also check your PostgreSQL logs for information. If you’re posting logs here for us to analyze, remember that they can contain sensitive information. Also please use the formatting tools to make it more readable (use preformatted text etc).
Thanks!
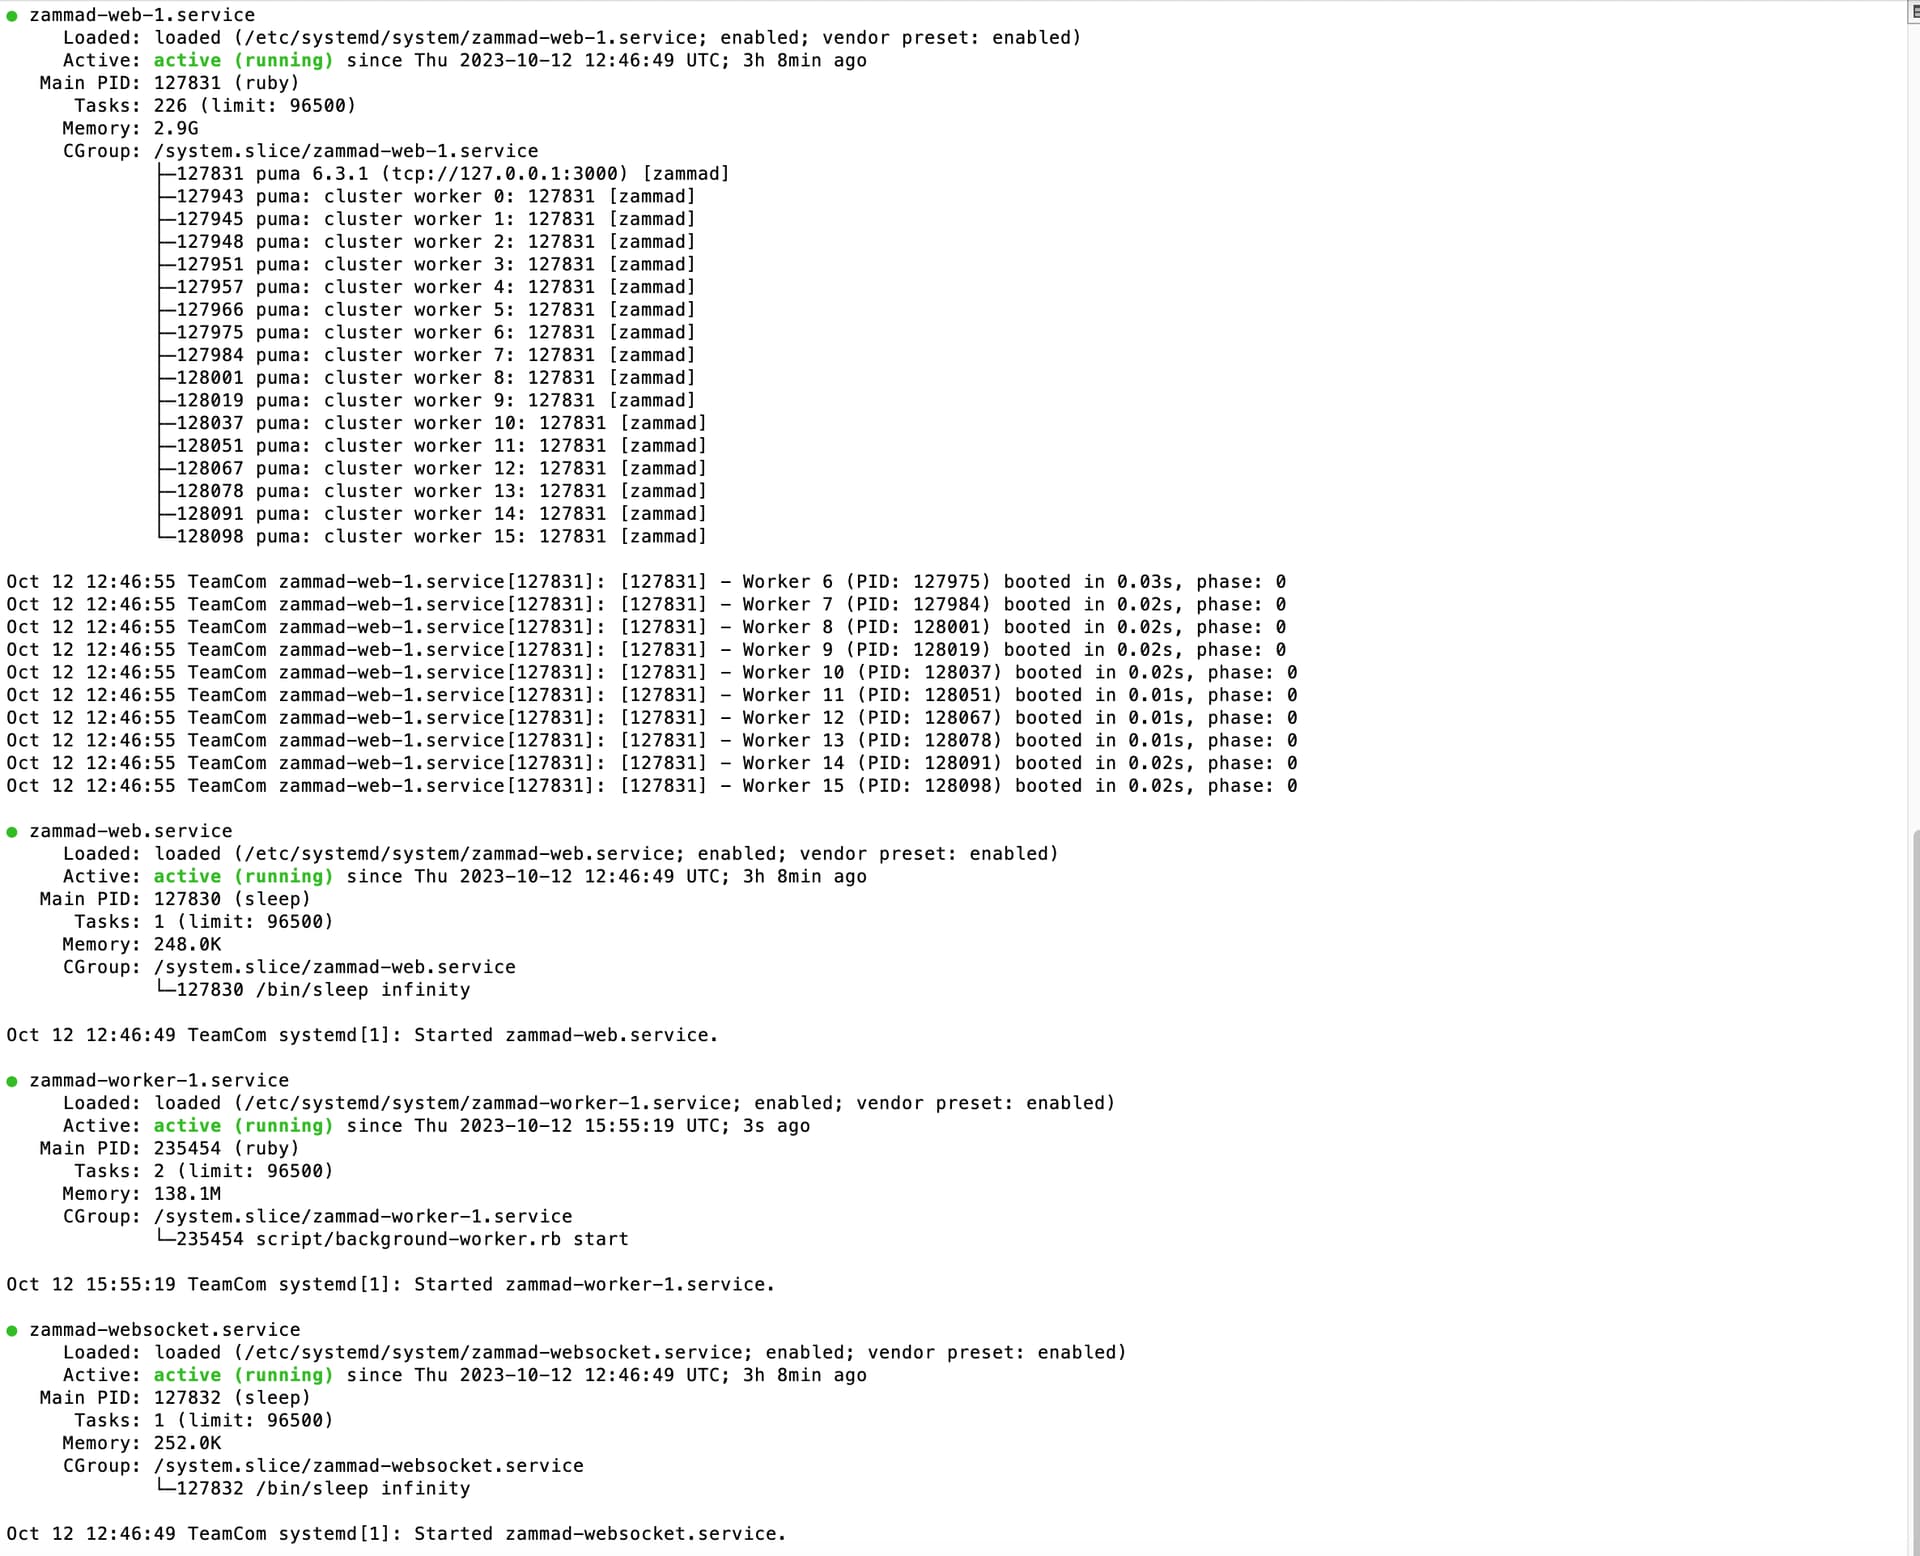
I have run systemctl status zammad* : Every things is green
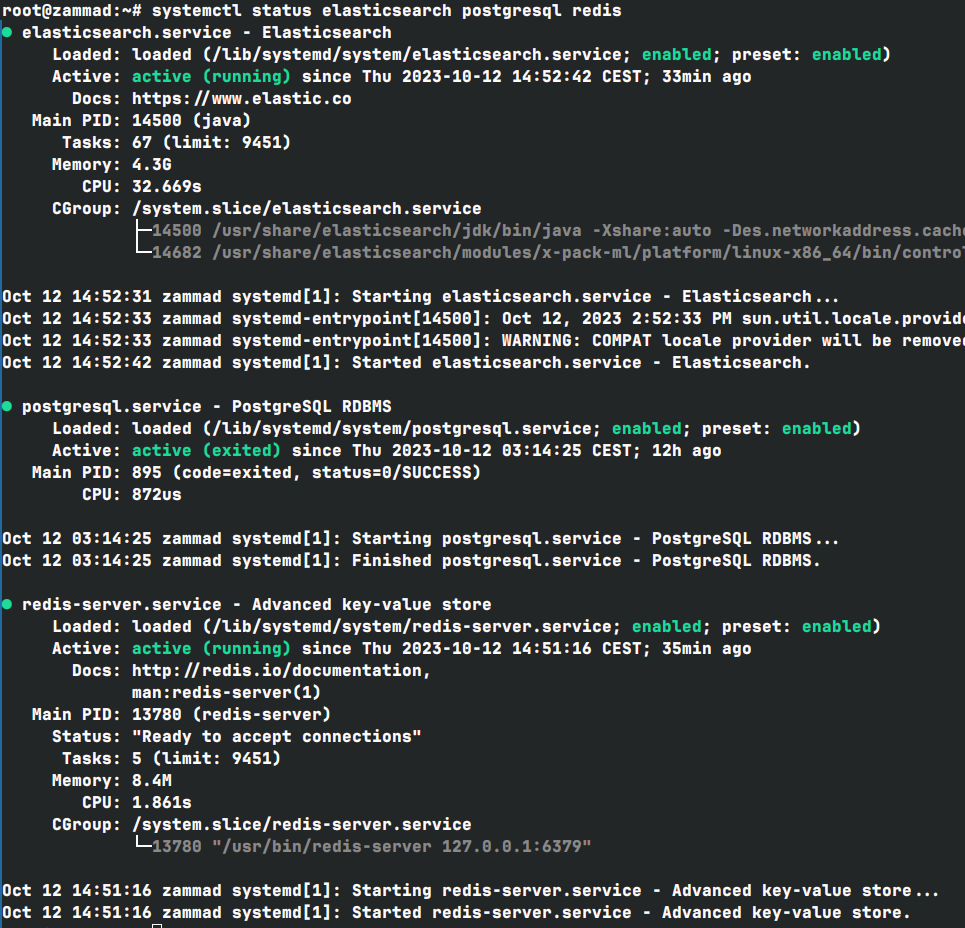
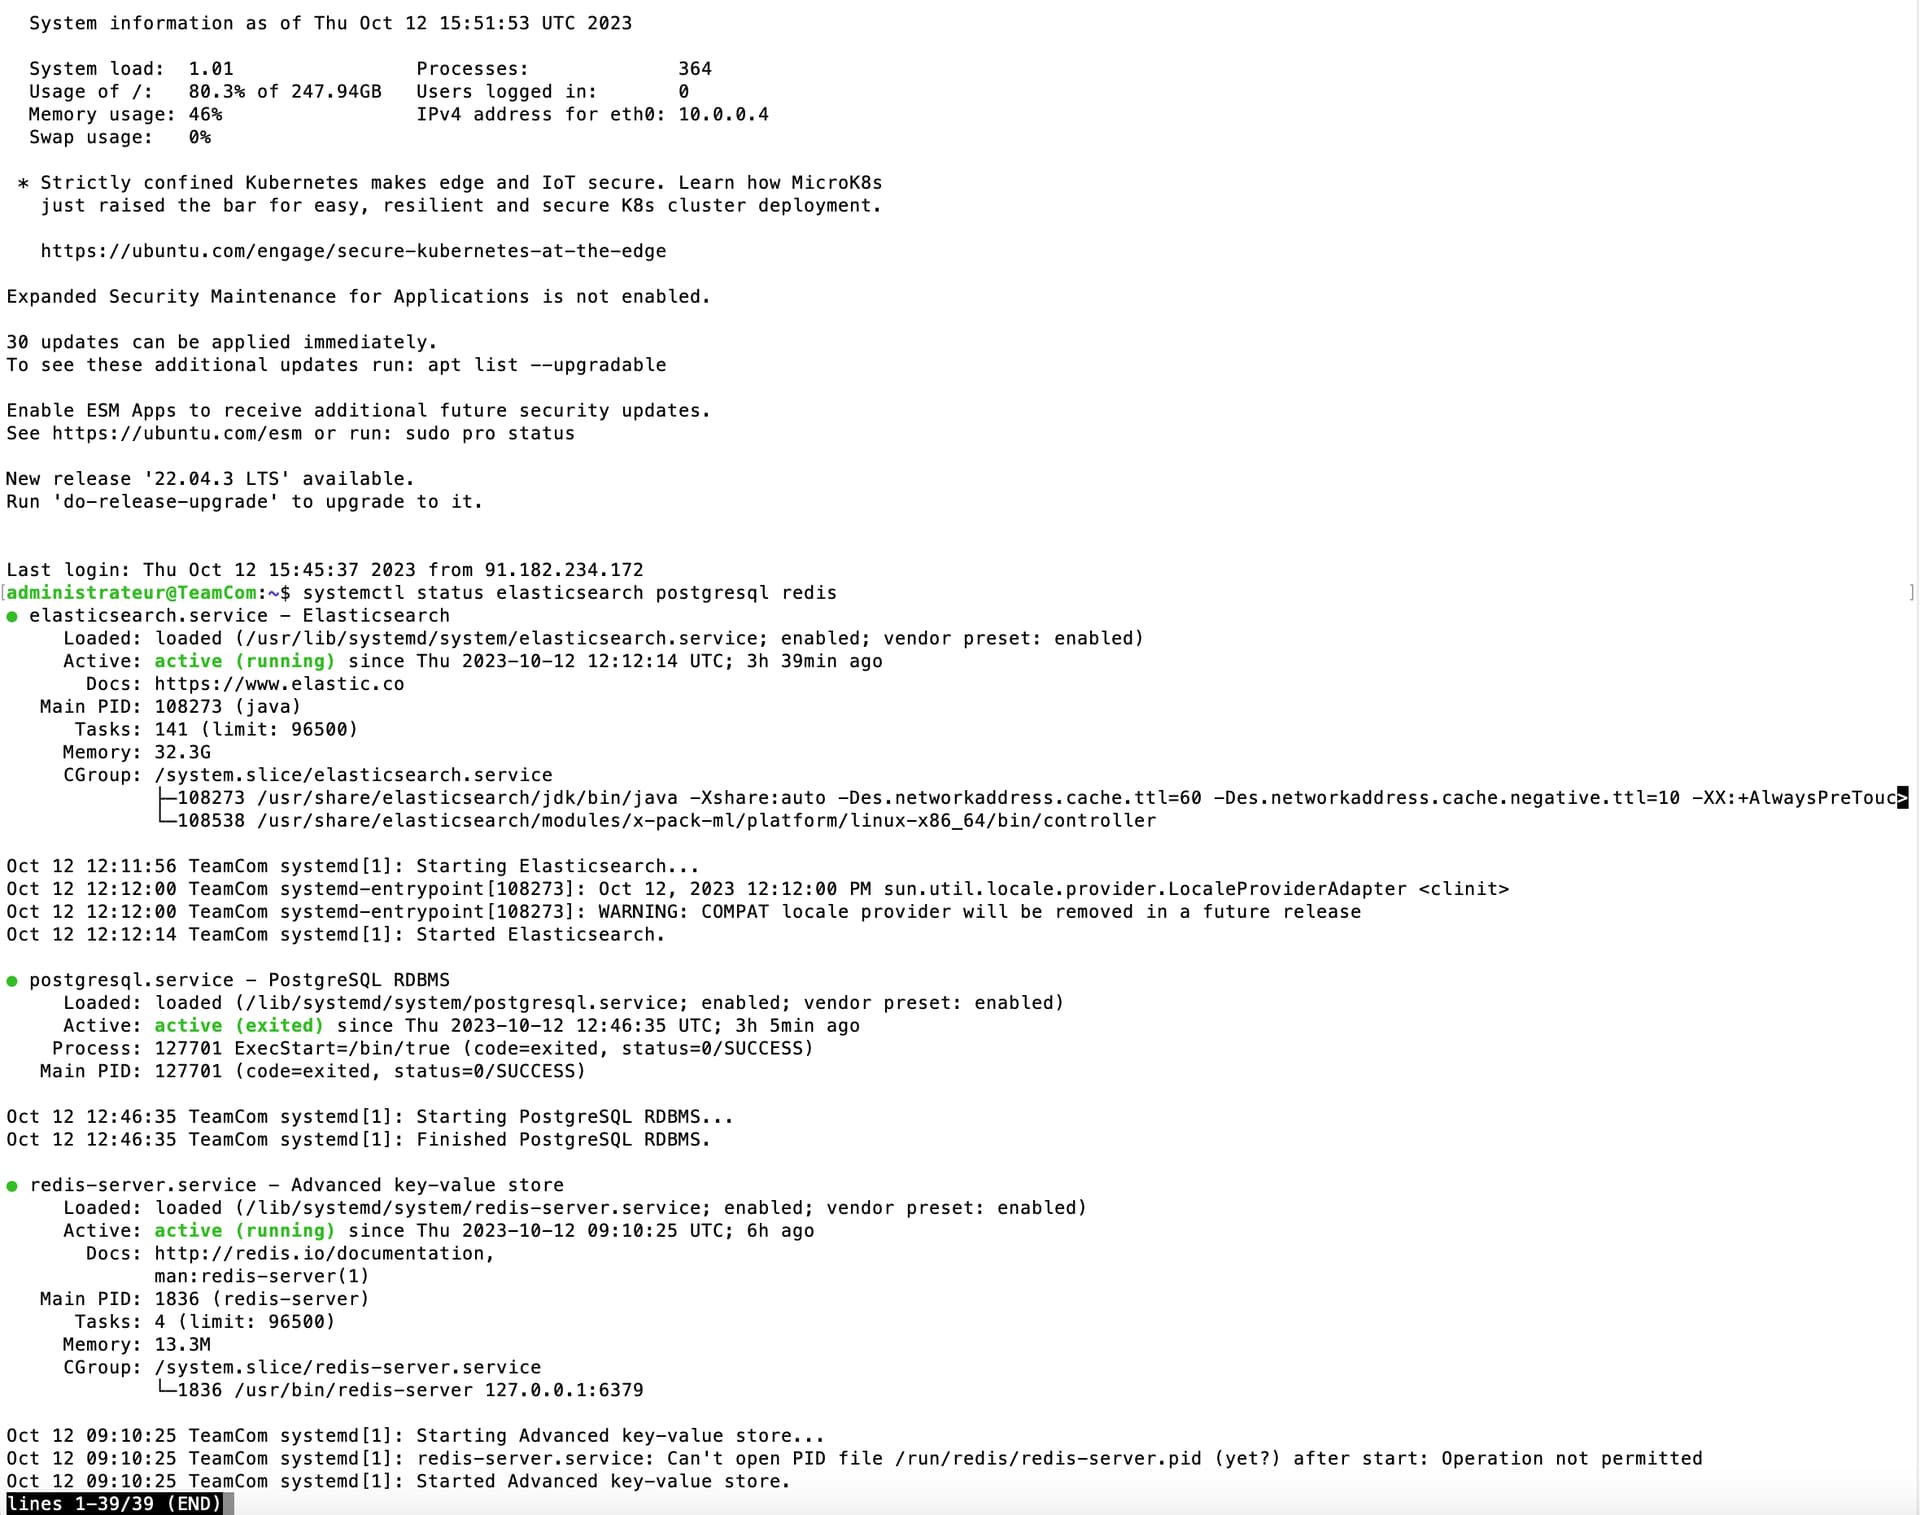
I have also run status all related dependant services systemctl status elasticsearch postgresql redis, and everythings is green too.
We are using apache and it is working fine as we are logging succesfully to the interface.
Any other command to see where the system is blocked?