I’m experiencing intermittent spikes in Zabbix monitoring related to Zammad Web UI availability.
I configured a Web Scenario in Zabbix to monitor the Zammad web interface and alert when the site becomes unavailable. Periodically, Zabbix reports “Zammad Web UI is down”. At the exact moment of the alert, the web interface noticeably freezes/lag for a few seconds and then immediately recovers, continuing to operate normally.
What makes this difficult to diagnose:
No errors in Zammad logs
No Nginx or application errors
No CPU, RAM, or I/O spikes
No network drops or connectivity issues
No visible service restarts
Zabbix server itself shows no resource spikes
The behavior looks like a short application stall (2–5 seconds), not a full outage.
Frequency varies sometimes once per day, sometimes every 30 minutes.
Has anyone encountered similar short “micro-outages” or brief UI stalls without corresponding log errors?
What would be the best way to instrument or test this further to identify the root cause (request timing, upstream latency, Puma workers, DB waits, etc.)?
With that heavy seperation, I’d assume you have quite a lot of users.
So you might want to provide the concurrent users and your performance tuning along.
Because this is extremely relevant for what anyone could answer here.
Yes, we have not tuned anything.
Mainly because the system is working stable, no spikes in usage, nothing.
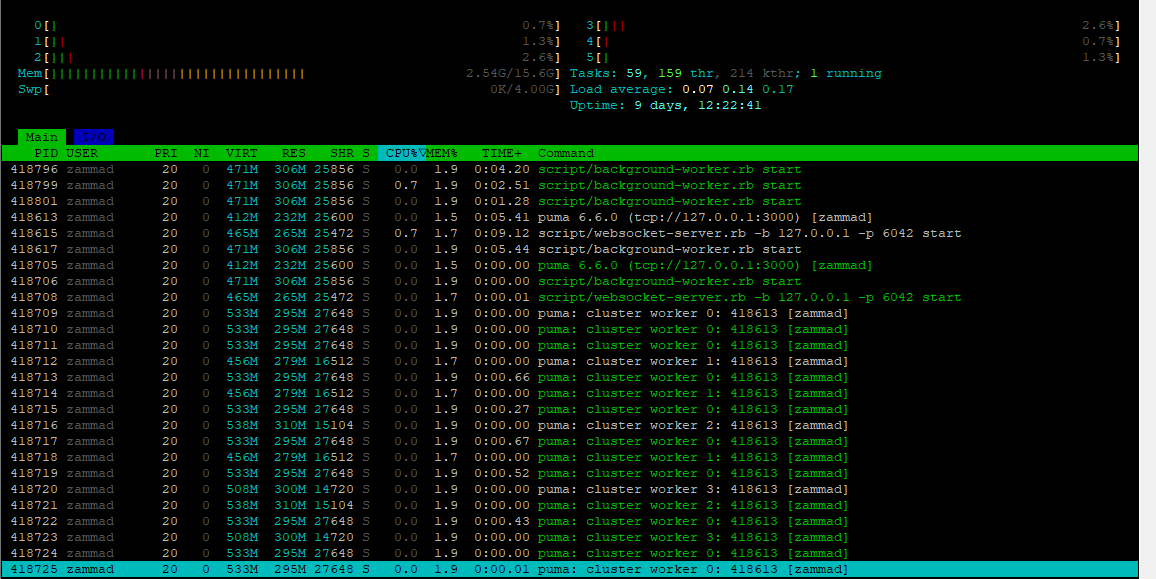
On app server we have 16% cpu usage stable, ram 8%.
Db server 2% cpu, 3% ram
Elastic 63%ram 7% cpu.
Hi, managed to get it working now.
Here and there we get a small spike, but not 20 times in a day as before, so performance will still need some tinkering with.
Thank you for this