Used Zammad version: 5.0.3-1640164755.
Used Grafana Version: 8.3.3
Used Elasticsearch Version: 7.16.2
Used Zammad installation type: package
Operating system: Ubuntu 20.04 LTS
Browser + version: chrome
Expected behavior:
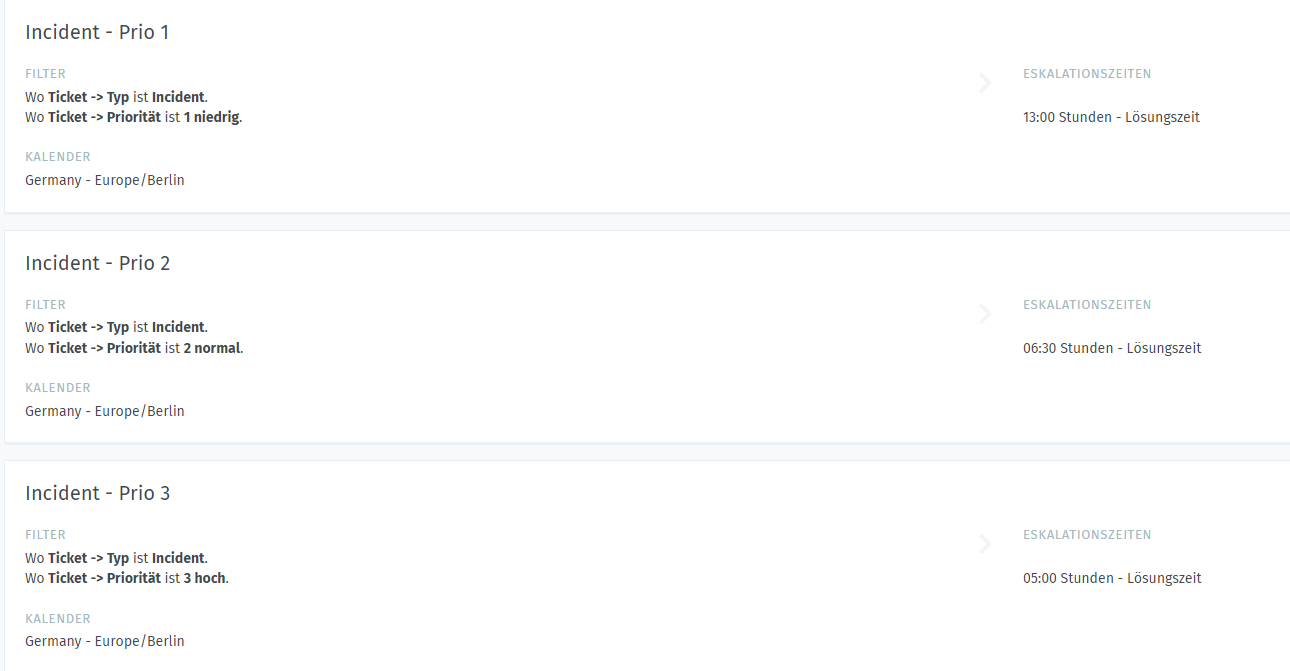
- SLA shows “case solved in time” and “case solved violated”
Actual behavior:
- no data shown
Steps to reproduce the behavior:
- update to newest Zammad, elasticsearch and grafana version
merry christmas everyone,
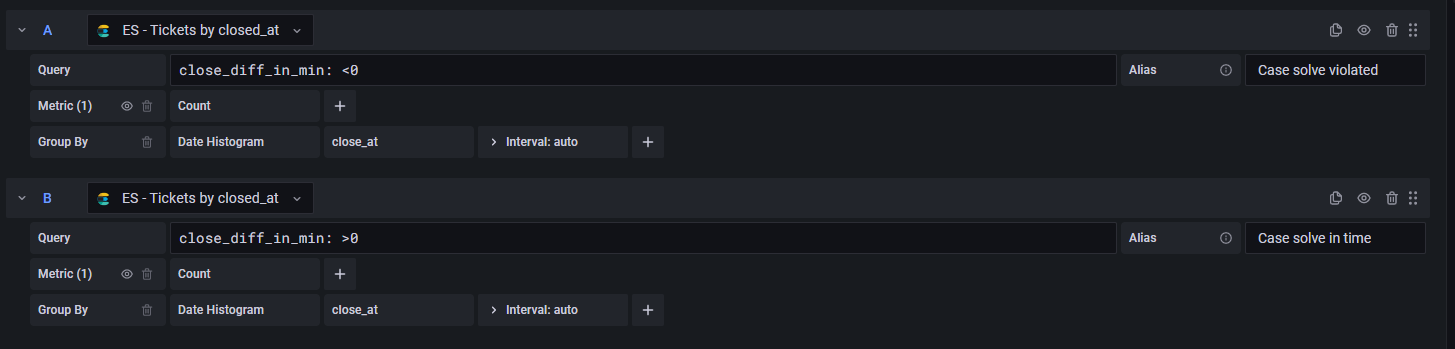
i updated zammad and elasticsearch to the newest version and noticed that in grafana “case solved in time” and “case solved violated” doesnt show any data anymore.
i changed the value “closed_escalated_at” to “close_at” and now the data appear again. did someone else noticed this and is this the right way to fix this?
thanks and grretings
Armin