Hmm, yes:
zammad ~ # docker logs -t --since 2019-06-24 zammaddockercompose_zammad-postgresql_1 2>&1 | sed -n '/deadlock/,/STATEMENT/p'
2019-06-24T07:44:25.657376582Z ERROR:  deadlock detected
2019-06-24T07:44:25.657689221Z DETAIL:  Process 45 waits for ShareLock on transaction 6189000; blocked by process 68.
2019-06-24T07:44:25.657699521Z  Process 68 waits for ShareLock on transaction 6189002; blocked by process 45.
2019-06-24T07:44:25.657706689Z  Process 45: SELECT  "taskbars".* FROM "taskbars" WHERE "taskbars"."id" = $1 LIMIT $2 FOR UPDATE
2019-06-24T07:44:25.657712927Z  Process 68: SELECT  "taskbars".* FROM "taskbars" WHERE "taskbars"."id" = $1 LIMIT $2 FOR UPDATE
2019-06-24T07:44:25.657718940Z HINT:  See server log for query details.
2019-06-24T07:44:25.657724645Z CONTEXT:  while locking tuple (31,9) in relation "taskbars"
2019-06-24T07:44:25.657730433Z STATEMENT:  SELECT  "taskbars".* FROM "taskbars" WHERE "taskbars"."id" = $1 LIMIT $2 FOR UPDATE
2019-06-24T11:53:03.856715173Z ERROR:  deadlock detected
2019-06-24T11:53:03.856760607Z DETAIL:  Process 1487 waits for ShareLock on transaction 6218274; blocked by process 48.
2019-06-24T11:53:03.856770665Z  Process 48 waits for ShareLock on transaction 6218273; blocked by process 1487.
2019-06-24T11:53:03.856779592Z  Process 1487: SELECT  "taskbars".* FROM "taskbars" WHERE "taskbars"."id" = $1 LIMIT $2 FOR UPDATE
2019-06-24T11:53:03.856787768Z  Process 48: SELECT  "taskbars".* FROM "taskbars" WHERE "taskbars"."id" = $1 LIMIT $2 FOR UPDATE
2019-06-24T11:53:03.856796565Z HINT:  See server log for query details.
2019-06-24T11:53:03.856804995Z CONTEXT:  while locking tuple (26,1) in relation "taskbars"
2019-06-24T11:53:03.856817215Z STATEMENT:  SELECT  "taskbars".* FROM "taskbars" WHERE "taskbars"."id" = $1 LIMIT $2 FOR UPDATE
2019-06-24T13:17:58.799566626Z ERROR:  deadlock detected
2019-06-24T13:17:58.799619666Z DETAIL:  Process 63 waits for ShareLock on transaction 6228171; blocked by process 60.
2019-06-24T13:17:58.799628023Z  Process 60 waits for ShareLock on transaction 6228170; blocked by process 63.
2019-06-24T13:17:58.799635164Z  Process 63: SELECT  "taskbars".* FROM "taskbars" WHERE "taskbars"."id" = $1 LIMIT $2 FOR UPDATE
2019-06-24T13:17:58.799642567Z  Process 60: SELECT  "taskbars".* FROM "taskbars" WHERE "taskbars"."id" = $1 LIMIT $2 FOR UPDATE
2019-06-24T13:17:58.799649448Z HINT:  See server log for query details.
2019-06-24T13:17:58.799656227Z CONTEXT:  while locking tuple (51,4) in relation "taskbars"
2019-06-24T13:17:58.799662852Z STATEMENT:  SELECT  "taskbars".* FROM "taskbars" WHERE "taskbars"."id" = $1 LIMIT $2 FOR UPDATE
2019-06-24T13:17:59.801475346Z ERROR:  deadlock detected
2019-06-24T13:17:59.801501308Z DETAIL:  Process 1385 waits for ShareLock on transaction 6228171; blocked by process 60.
2019-06-24T13:17:59.801511327Z  Process 60 waits for ShareLock on transaction 6228172; blocked by process 1385.
2019-06-24T13:17:59.801520060Z  Process 1385: SELECT  "taskbars".* FROM "taskbars" WHERE "taskbars"."id" = $1 LIMIT $2 FOR UPDATE
2019-06-24T13:17:59.801529486Z  Process 60: SELECT  "taskbars".* FROM "taskbars" WHERE "taskbars"."id" = $1 LIMIT $2 FOR UPDATE
2019-06-24T13:17:59.801537741Z HINT:  See server log for query details.
2019-06-24T13:17:59.801544943Z CONTEXT:  while locking tuple (67,8) in relation "taskbars"
2019-06-24T13:17:59.801552213Z STATEMENT:  SELECT  "taskbars".* FROM "taskbars" WHERE "taskbars"."id" = $1 LIMIT $2 FOR UPDATE
2019-06-24T13:18:47.135526182Z ERROR:  deadlock detected
2019-06-24T13:18:47.135607839Z DETAIL:  Process 43 waits for ShareLock on transaction 6228283; blocked by process 1485.
2019-06-24T13:18:47.135619511Z  Process 1485 waits for ShareLock on transaction 6228282; blocked by process 43.
2019-06-24T13:18:47.135628548Z  Process 43: SELECT  "taskbars".* FROM "taskbars" WHERE "taskbars"."id" = $1 LIMIT $2 FOR UPDATE
2019-06-24T13:18:47.135637685Z  Process 1485: SELECT  "taskbars".* FROM "taskbars" WHERE "taskbars"."id" = $1 LIMIT $2 FOR UPDATE
2019-06-24T13:18:47.135647791Z HINT:  See server log for query details.
2019-06-24T13:18:47.135686940Z CONTEXT:  while locking tuple (5,14) in relation "taskbars"
2019-06-24T13:18:47.135693925Z STATEMENT:  SELECT  "taskbars".* FROM "taskbars" WHERE "taskbars"."id" = $1 LIMIT $2 FOR UPDATE
2019-06-24T13:52:00.371259039Z ERROR:  deadlock detected
2019-06-24T13:52:00.371307784Z DETAIL:  Process 1315 waits for ShareLock on transaction 6231337; blocked by process 1388.
2019-06-24T13:52:00.371321089Z  Process 1388 waits for ShareLock on transaction 6231336; blocked by process 1315.
2019-06-24T13:52:00.371334254Z  Process 1315: SELECT  "taskbars".* FROM "taskbars" WHERE "taskbars"."id" = $1 LIMIT $2 FOR UPDATE
2019-06-24T13:52:00.371347504Z  Process 1388: SELECT  "taskbars".* FROM "taskbars" WHERE "taskbars"."id" = $1 LIMIT $2 FOR UPDATE
2019-06-24T13:52:00.371360438Z HINT:  See server log for query details.
2019-06-24T13:52:00.371371303Z CONTEXT:  while locking tuple (23,4) in relation "taskbars"
2019-06-24T13:52:00.371429580Z STATEMENT:  SELECT  "taskbars".* FROM "taskbars" WHERE "taskbars"."id" = $1 LIMIT $2 FOR UPDATE
2019-06-25T06:17:47.632614397Z ERROR:  deadlock detected
2019-06-25T06:17:47.634605273Z DETAIL:  Process 1228 waits for ShareLock on transaction 6281040; blocked by process 68.
2019-06-25T06:17:47.634626395Z  Process 68 waits for ShareLock on transaction 6281041; blocked by process 1228.
2019-06-25T06:17:47.634635037Z  Process 1228: SELECT  "taskbars".* FROM "taskbars" WHERE "taskbars"."id" = $1 LIMIT $2 FOR UPDATE
2019-06-25T06:17:47.634643531Z  Process 68: SELECT  "taskbars".* FROM "taskbars" WHERE "taskbars"."id" = $1 LIMIT $2 FOR UPDATE
2019-06-25T06:17:47.634651594Z HINT:  See server log for query details.
2019-06-25T06:17:47.634659521Z CONTEXT:  while locking tuple (55,15) in relation "taskbars"
2019-06-25T06:17:47.634667546Z STATEMENT:  SELECT  "taskbars".* FROM "taskbars" WHERE "taskbars"."id" = $1 LIMIT $2 FOR UPDATE
2019-06-25T06:17:48.632473613Z ERROR:  deadlock detected
2019-06-25T06:17:48.632510046Z DETAIL:  Process 1485 waits for ShareLock on transaction 6281040; blocked by process 68.
2019-06-25T06:17:48.632533985Z  Process 68 waits for ShareLock on transaction 6281048; blocked by process 1485.
2019-06-25T06:17:48.632541756Z  Process 1485: SELECT  "taskbars".* FROM "taskbars" WHERE "taskbars"."id" = $1 LIMIT $2 FOR UPDATE
2019-06-25T06:17:48.632548870Z  Process 68: SELECT  "taskbars".* FROM "taskbars" WHERE "taskbars"."id" = $1 LIMIT $2 FOR UPDATE
2019-06-25T06:17:48.632555652Z HINT:  See server log for query details.
2019-06-25T06:17:48.632562158Z CONTEXT:  while locking tuple (55,15) in relation "taskbars"
2019-06-25T06:17:48.632568675Z STATEMENT:  SELECT  "taskbars".* FROM "taskbars" WHERE "taskbars"."id" = $1 LIMIT $2 FOR UPDATE
2019-06-25T07:35:05.892212381Z ERROR:  deadlock detected
2019-06-25T07:35:05.892261062Z DETAIL:  Process 10342 waits for ShareLock on transaction 6289115; blocked by process 2183.
2019-06-25T07:35:05.892275706Z  Process 2183 waits for ShareLock on transaction 6289114; blocked by process 10342.
2019-06-25T07:35:05.892287668Z  Process 10342: SELECT  "taskbars".* FROM "taskbars" WHERE "taskbars"."id" = $1 LIMIT $2 FOR UPDATE
2019-06-25T07:35:05.892299410Z  Process 2183: SELECT  "taskbars".* FROM "taskbars" WHERE "taskbars"."id" = $1 LIMIT $2 FOR UPDATE
2019-06-25T07:35:05.892321434Z HINT:  See server log for query details.
2019-06-25T07:35:05.892333080Z CONTEXT:  while locking tuple (16,4) in relation "taskbars"
2019-06-25T07:35:05.892342443Z STATEMENT:  SELECT  "taskbars".* FROM "taskbars" WHERE "taskbars"."id" = $1 LIMIT $2 FOR UPDATE
2019-06-25T07:42:31.190326862Z ERROR:  deadlock detected
2019-06-25T07:42:31.190400978Z DETAIL:  Process 48 waits for ShareLock on transaction 6289911; blocked by process 1483.
2019-06-25T07:42:31.190414418Z  Process 1483 waits for ShareLock on transaction 6289912; blocked by process 48.
2019-06-25T07:42:31.190423931Z  Process 48: SELECT  "taskbars".* FROM "taskbars" WHERE "taskbars"."id" = $1 LIMIT $2 FOR UPDATE
2019-06-25T07:42:31.190433294Z  Process 1483: SELECT  "taskbars".* FROM "taskbars" WHERE "taskbars"."id" = $1 LIMIT $2 FOR UPDATE
2019-06-25T07:42:31.190463578Z HINT:  See server log for query details.
2019-06-25T07:42:31.190473274Z CONTEXT:  while locking tuple (64,12) in relation "taskbars"
2019-06-25T07:42:31.190482369Z STATEMENT:  SELECT  "taskbars".* FROM "taskbars" WHERE "taskbars"."id" = $1 LIMIT $2 FOR UPDATE
2019-06-25T08:01:22.023816837Z ERROR:  deadlock detected
2019-06-25T08:01:22.023885166Z DETAIL:  Process 1378 waits for ShareLock on transaction 6292746; blocked by process 60.
2019-06-25T08:01:22.023897321Z  Process 60 waits for ShareLock on transaction 6292747; blocked by process 1378.
2019-06-25T08:01:22.023904958Z  Process 1378: SELECT  "taskbars".* FROM "taskbars" WHERE "taskbars"."id" = $1 LIMIT $2 FOR UPDATE
2019-06-25T08:01:22.023912617Z  Process 60: SELECT  "taskbars".* FROM "taskbars" WHERE "taskbars"."id" = $1 LIMIT $2 FOR UPDATE
2019-06-25T08:01:22.023920106Z HINT:  See server log for query details.
2019-06-25T08:01:22.023927066Z CONTEXT:  while locking tuple (52,4) in relation "taskbars"
2019-06-25T08:01:22.023934335Z STATEMENT:  SELECT  "taskbars".* FROM "taskbars" WHERE "taskbars"."id" = $1 LIMIT $2 FOR UPDATE
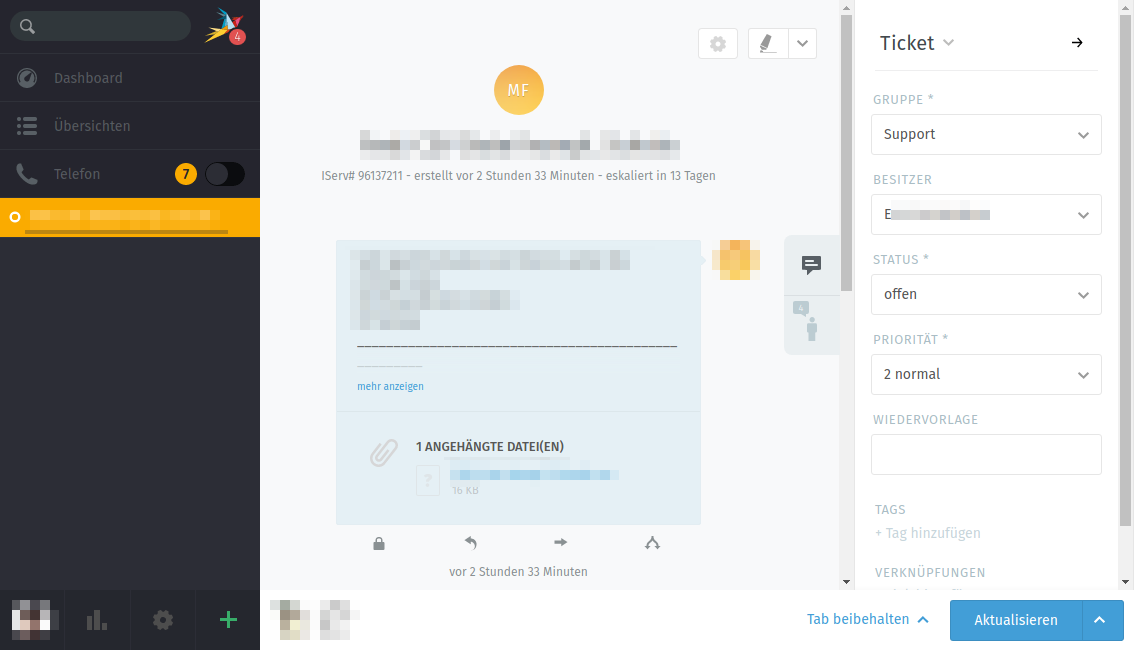
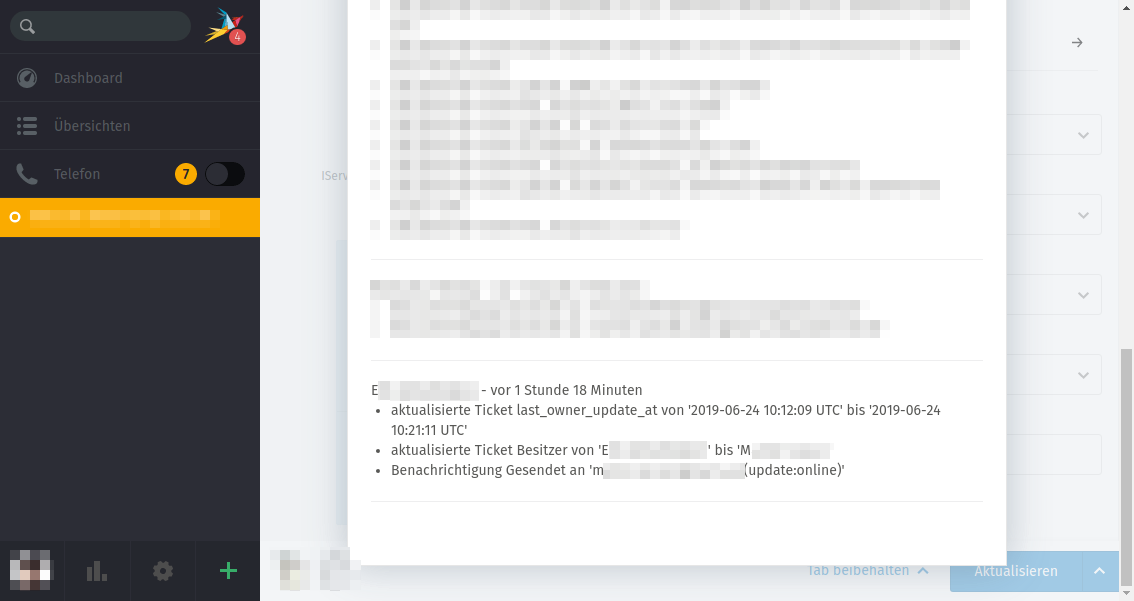
I was curious if one of these deadlocks corresponded to the request that transferred the ticket, but as far as I can tell, this was not the case. The ticket history shows that the ticket was transferred on 2019-06-24 12:21. Zammad doesn’t explicitly state the time zone, but I’ll assume it’s UTC+2. Apache confirms that a PUT request was made at that time with UTC+2:
zammad ~ # grep PUT /var/log/apache2/access.log.1 | grep 13755
...:34d2 - - [24/Jun/2019:11:37:34 +0200] "PUT /api/v1/tickets/13755?all=true HTTP/1.1" 200 18253 "https://zammad.ourcompany.tld/" "Mozilla/5.0 (Windows NT 10.0; Win64; x64) AppleWebKit/537.36 (KHTML, like Gecko) Chrome/75.0.3770.100 Safari/537.36"
...:34d2 - - [24/Jun/2019:12:21:11 +0200] "PUT /api/v1/tickets/13755?all=true HTTP/1.1" 200 18623 "https://zammad.ourcompany.tld/" "Mozilla/5.0 (Windows NT 10.0; Win64; x64) AppleWebKit/537.36 (KHTML, like Gecko) Chrome/75.0.3770.100 Safari/537.36"
...:fd8f - - [24/Jun/2019:13:52:54 +0200] "PUT /api/v1/tickets/13755?all=true HTTP/1.1" 200 18593 "https://zammad.ourcompany.tld/" "Mozilla/5.0 (X11; Linux x86_64) AppleWebKit/537.36 (KHTML, like Gecko) Chrome/75.0.3770.100 Safari/537.36"
...:fd8f - - [24/Jun/2019:13:52:59 +0200] "PUT /api/v1/tickets/13755?all=true HTTP/1.1" 200 18589 "https://zammad.ourcompany.tld/" "Mozilla/5.0 (X11; Linux x86_64) AppleWebKit/537.36 (KHTML, like Gecko) Chrome/75.0.3770.100 Safari/537.36"
...:b047 - - [24/Jun/2019:13:59:46 +0200] "PUT /api/v1/tickets/13755?all=true HTTP/1.1" 200 20352 "https://zammad.ourcompany.tld/" "Mozilla/5.0 (Windows NT 10.0; Win64; x64; rv:60.0) Gecko/20100101 Firefox/60.0"
docker logs -t reports timestamps with UTC, and 12:21 UTC+2 is 10:21 UTC. There are a lot of “too many clients” error messages at this point (see below why, and how I resolved that):
zammad ~ # docker logs -t --since 2019-06-24 zammaddockercompose_zammad-postgresql_1 2>&1 | grep 'T10:21' | head
2019-06-24T10:21:05.835648645Z FATAL:  sorry, too many clients already
2019-06-24T10:21:06.949779061Z FATAL:  sorry, too many clients already
2019-06-24T10:21:07.925421454Z FATAL:  sorry, too many clients already
2019-06-24T10:21:09.929663411Z FATAL:  sorry, too many clients already
2019-06-24T10:21:14.560771747Z FATAL:  sorry, too many clients already
2019-06-24T10:21:14.563506421Z FATAL:  sorry, too many clients already
2019-06-24T10:21:15.642579625Z FATAL:  sorry, too many clients already
2019-06-24T10:21:15.676729954Z FATAL:  sorry, too many clients already
2019-06-24T10:21:16.090592950Z FATAL:  sorry, too many clients already
2019-06-24T10:21:17.671112494Z FATAL:  sorry, too many clients already

zammad ~ # docker logs -t --since 2019-06-24 zammaddockercompose_zammad-postgresql_1 2>&1 | grep 'T10:21' | wc -l
61
But no deadlock, and according to the deadlock logs above the last deadlock before that was at 07:44 UTC, and the next one at 11:53 UTC.
In general we’re currently having a bit of performance troubles with Zammad, which might be related to this issue. I hadn’t posted about those yet because I’m still not completely convinced that it isn’t our own fault due to underpowered hardware. As it may be relevant now, I’ll try to sum up what we experienced and tried so far:
-
During testing with only a very few agents, performance was fantastic.
-
After migrating the company to Zammad proper, we’ve started to receive complaints about slow responses from some agents; delays up to 30 seconds were reported.
-
I suspected our hardware as the root cause. Back then, we were running Zammad in a Xen VM on a host that had only 32 GB RAM, and only 7 GB were available for Zammad, which is far below the 12 GB recommended for running everything on the same server. This was obviously bad:
zammad ~ # free -m
			  total        used        free      shared  buff/cache   available
Mem:           7015        6635          69          60         310         233
Swap:           511         403         108
I scraped a bit more RAM together and raised the VM to 10 GB, reduced ES to 1 GB heap and enabled the RUBY_GC_ stuff for the scheduler which relieved the memory pressure a bit.
-
I started to fiddle with the railsserver logs to determine actual response times, so that I could tell if I was improving it. I used request-log-analyzer to generate HTML reports, and apparently it was still pretty bad; I’ve attached an older report (2019-06-14-10000.html).
-
We moved Zammad to a KVM VM on another host that has 512 GB RAM. Zammad now has 16 GB RAM, so at least no more memory issues  At this point, ES was already back to 2 GB heap because my change had been overridden by a container update, but I haven’t removed the GC settings for the scheduler yet.
-
We found out about WEB_CONCURRENCY and started to suspect that slow requests might blocking our puma threads, and thereby causing other requests to needlessly block too. We’ve increased it to 4, and I think it has improved significantly, but there’s still room for improvement (see new report 2019-06-25-10000.html). I’ve written a short script that analyzes the last 20000 log lines to give me a quick overview:
zammad ~ # cat performance
#!/bin/bash

TEMP="$(mktemp --tmpdir zammad-performance.XXXXXXXXXXXX)"
docker logs zammaddockercompose_zammad-railsserver_1 --tail 20000 > "$TEMP" 2>/dev/null

TIME="$(grep "^I," "$TEMP" | head -n1 | awk '{print $2}' | sed 's/^\[//; s/T/ /')"
echo "Parsing logs since $TIME..."
echo

read -r COUNT MIN MAX MEAN MEDIAN < <(grep Completed "$TEMP" | \
	sed -r 's/.* in ([0-9]+)ms .*/\1/' | \
	datamash -s count 1 min 1 max 1 mean 1 median 1)

echo "Requests: $COUNT"
echo "Minimum response time: $MIN"
echo "Maximum response time: $MAX"
echo "Mean response time: $MEAN"
echo "Median response time: $MEDIAN"

echo
echo "Slowest requests:"
grep Completed "$TEMP" | sort -n -k 11,11 | tail

echo
echo "Last requests:"
grep Completed "$TEMP" | tail

rm -f "$TEMP"
zammad ~ # ./performance
Parsing logs since 2019-06-25 08:02:48.109192...

Requests: 4019
Minimum response time: 4
Maximum response time: 9387
Mean response time: 585,98482209505
Median response time: 137

Slowest requests:
I, [2019-06-25T08:10:10.178417 #60-69937209130220]  INFO -- : Completed 200 OK in 6315ms (Views: 927.3ms | ActiveRecord: 138.2ms)
I, [2019-06-25T08:55:24.645646 #25-69936769349820]  INFO -- : Completed 200 OK in 6361ms (Views: 160.6ms | ActiveRecord: 644.1ms)
I, [2019-06-25T08:55:24.401727 #25-69937240952620]  INFO -- : Completed 200 OK in 6381ms (Views: 167.8ms | ActiveRecord: 565.2ms)
I, [2019-06-25T08:10:10.018594 #32-69936817011900]  INFO -- : Completed 200 OK in 6531ms (Views: 462.5ms | ActiveRecord: 214.8ms)
I, [2019-06-25T08:25:26.242219 #25-69937374594500]  INFO -- : Completed 200 OK in 6687ms (Views: 23.8ms | ActiveRecord: 443.7ms)
I, [2019-06-25T08:08:18.079191 #32-69936827533860]  INFO -- : Completed 200 OK in 6828ms (Views: 6067.5ms | ActiveRecord: 25.7ms)
I, [2019-06-25T08:55:21.923188 #25-69937107971400]  INFO -- : Completed 200 OK in 6876ms (Views: 122.6ms | ActiveRecord: 638.2ms)
I, [2019-06-25T08:07:20.791170 #25-69937109963600]  INFO -- : Completed 200 OK in 7187ms (Views: 808.8ms | ActiveRecord: 161.8ms)
I, [2019-06-25T08:55:23.258927 #25-47128705460980]  INFO -- : Completed 200 OK in 8286ms (Views: 102.0ms | ActiveRecord: 1003.3ms)
I, [2019-06-25T08:07:24.090186 #25-69936769796060]  INFO -- : Completed 200 OK in 9387ms (Views: 4191.4ms | ActiveRecord: 23.9ms)

Last requests:
I, [2019-06-25T09:10:15.659719 #25-69936769349820]  INFO -- : Completed 404 Not Found in 15ms (Views: 0.2ms | ActiveRecord: 2.4ms)
I, [2019-06-25T09:10:17.065978 #25-69936775746620]  INFO -- : Completed 200 OK in 188ms (Views: 30.7ms | ActiveRecord: 4.4ms)
I, [2019-06-25T09:10:17.132788 #60-69937209130220]  INFO -- : Completed 200 OK in 17ms (Views: 0.2ms | ActiveRecord: 5.5ms)
I, [2019-06-25T09:10:18.445930 #60-47128713142580]  INFO -- : Completed 200 OK in 198ms (Views: 30.8ms | ActiveRecord: 4.7ms)
I, [2019-06-25T09:10:18.512384 #25-47128704114900]  INFO -- : Completed 200 OK in 17ms (Views: 0.3ms | ActiveRecord: 4.8ms)
I, [2019-06-25T09:10:18.543792 #60-69937113366380]  INFO -- : Completed 200 OK in 24ms (Views: 0.3ms | ActiveRecord: 5.0ms)
I, [2019-06-25T09:10:18.725527 #25-69937108280700]  INFO -- : Completed 200 OK in 195ms (Views: 34.2ms | ActiveRecord: 4.6ms)
I, [2019-06-25T09:10:18.957841 #25-69936904236140]  INFO -- : Completed 200 OK in 218ms (Views: 39.5ms | ActiveRecord: 11.9ms)
I, [2019-06-25T09:10:19.163537 #32-69936816872260]  INFO -- : Completed 200 OK in 225ms (Views: 47.4ms | ActiveRecord: 5.2ms)
I, [2019-06-25T09:10:19.271522 #32-69936822591660]  INFO -- : Completed 200 OK in 27ms (Views: 0.2ms | ActiveRecord: 11.7ms)
-
We’ve started to get reports about 500 error messages, and we quickly figured out that postgres had too many connections. I’ve raised max_connections to 200 and haven’t seen a “sorry, too many clients already” error since then.
Very certain all agents. In the case described above, M notified me that E had transferred the ticket to him but that Zammad still showed E as the owner, and it was the same for me (all the screenshots above are from me). So at the very least we both were affected, and this leads me to believe that anyone else who would’ve tried would have been affected too.
EDIT: of course forget to attach the files:
2019-06-11-10000.html: https://pste.eu/p/GDOf.html
2019-06-25-10000.html: https://pste.eu/p/6RO2.html