I had to dig within the code to even see why this may happen.
Reason: I never see those two widgets in question other than green - but this may be due me working within Zammad the whole day.
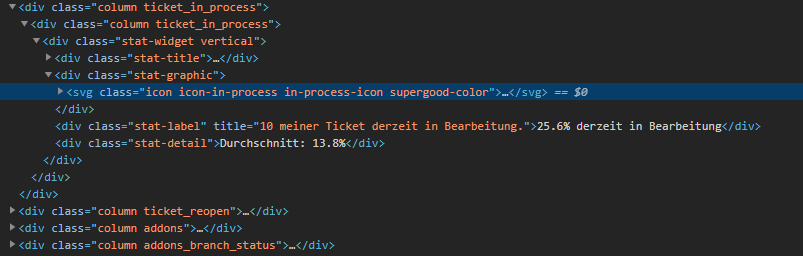
So, those are the two relevant lines from widget point of view:
Which ends up in something like this within the code:
The supergood-color is part of the color schemes, mainly SLA related. It seems to be reused here.
As a side note, as it’s not really relevant directly.
The relevant controllers life here:
It looks like Zammad calculates on “how bad” you run your ticket world in the time period.
The following is a guess, because I gave up digging deeper (bunny holes, you know)…:
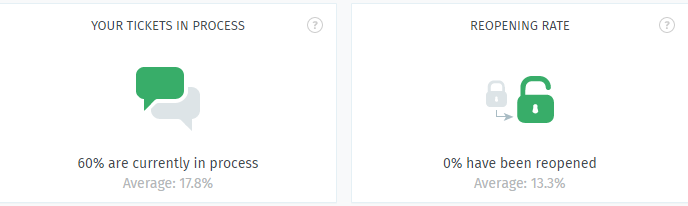
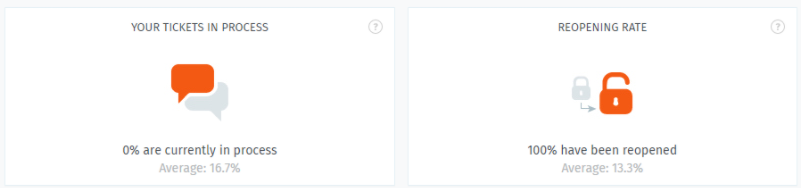
It looks like that the higher your reopen rate is, the worse the icon color will turn.
The higher your “currently in progress” is, the better the icon color will get.
From own stats I can say Zammad will consider a reopen rate of below 10% and “currently in progress” rate around 25% as “good”.
I however couldn’t find the switches in which situation it gets better or worse.
I hope it helps anyway.
I would add that Zammad seems to recalculate the stats once per day and not in real time. That also explains why, say, opened tickets differ from the numbers shown in the stats.
It’s not life-critical. I was just curious about the reasons why things were so… and you clearly explained it, so thanks again!
Correct.
The Dashboard itself usually gets refresh every 15 minutes.
The stats themselves are information from within the last 24 hours which is why your overall progress tickets may be higher than they would be if you calculate from day start.