Hm, you’re right, it does use a lot of memory on your server. On mine it looks like this:
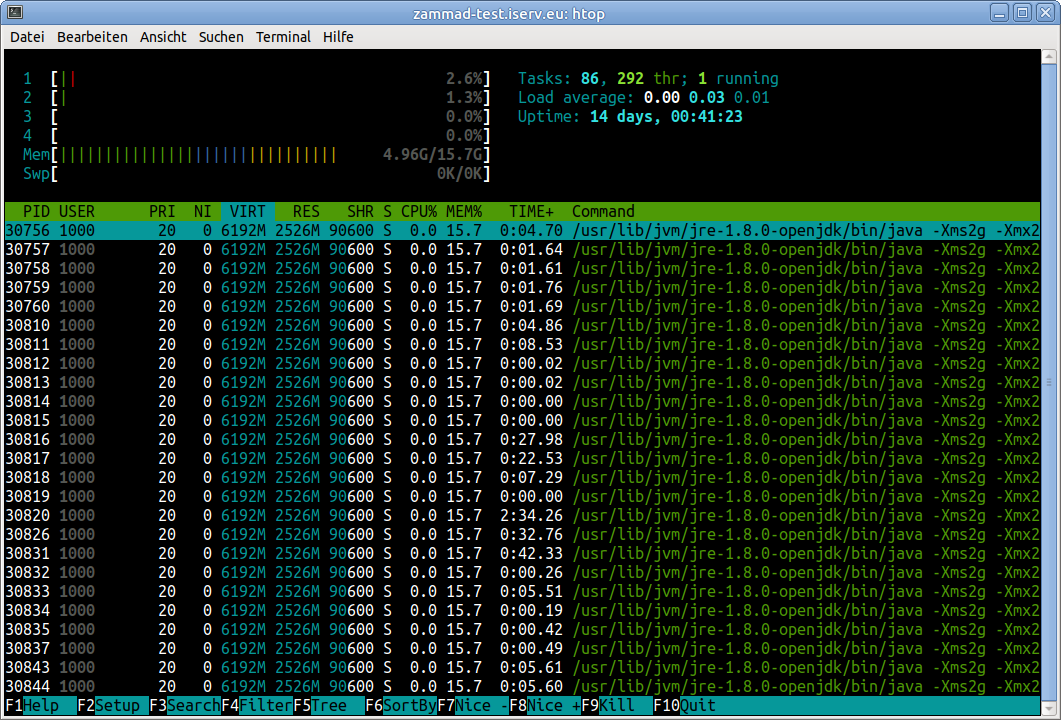
I think RES is the more relevant column here, so my ElasticSearch/Java seems to use ~2.5 GB, and yours seems to use ~4.5 GB. Sorted by RES, the next process is in the list is scheduler.rb with ~1.4 GB.
I don’t know much about Java, but those -Xms2g -Xmx2g options in my jvm processes vs. the -Xms4g -Xmx4g in your jvm process sound like they might be very relevant here. Maybe Java just allocates at least this much memory? Sure sounds like it:
The flag
Xmxspecifies the maximum memory allocation pool for a Java virtual machine (JVM), whileXmsspecifies the initial memory allocation pool.This means that your JVM will be started with
Xmsamount of memory and will be able to use a maximum ofXmxamount of memory.
I’m using zammad-docker-compose, and as far as I can tell, these values aren’t explicitly configured by Zammad anywhere. 2 GB just seems to be the default of the ElasticSearch docker container as provided by ElasticSearch, and is configured in config/jvm.options in the image:
[elasticsearch@64c5253c5755 ~]$ cat config/jvm.options
## JVM configuration

################################################################
## IMPORTANT: JVM heap size
################################################################
##
## You should always set the min and max JVM heap
## size to the same value. For example, to set
## the heap to 4 GB, set:
##
## -Xms4g
## -Xmx4g
##
## See https://www.elastic.co/guide/en/elasticsearch/reference/current/heap-size.html
## for more information
##
################################################################

# Xms represents the initial size of total heap space
# Xmx represents the maximum size of total heap space

-Xms2g
-Xmx2g
[...]
Not sure where your values might come from?