Hi, Zammad is right now using 7GB out of 8GB Memory.
My question is how do I reduce the amount of memory, the system is using ?
I read about WEB_CONCURRENCY but when I do a
zammad config:get WEB_CONCURRENCY
I get no information at all and before setting a new value I’d like to know the current one.
Did i messed up the command or how do I get the information ?
The Client storage option is also enabled in the backend.
I also read about using a RAMDISK for more performance, but which part of zammad do I have to put on the RAMDISK ?
The next would be to seperate the elastic search server from the current server where also zammad is running on.
Maybe there is a best practice performance guide ?
Just my opinion, but every megabyte you can have in RAM, is a good megabyte.
Reason for this is simply a way faster access to your data, as as soon as your storage kicks in, you’ll get slower (that’s just normal).
But: I doubt that only Zammad is taking 7 GB of RAM, I guess it’s a combination of your database server, elasticsearch and Zammad. We don’t have a best practice guide for performance. Sorry.
You’ll want to put /opt/zammad/tmp/ into ramdisk.
Please note that tmp/ might contain unprocessible mails in some state, so before restarting your machine you might want to check that. If you don’t to it right on ramdisk, the data will be gone forever.
May I ask what the real problem is? Are you experiencing a slow Zammad?
Right now it seems that Zammad is working stable and with good performance.
But we are going to prepare for the case that we are going to have 100 more users in 2 month, so we’d like to build up a good base so that we’re not running in any bottleneck or performance issues.
Slight off-topic: is having a 8000 clients (not Agents) in Zammad will heavily impact the system? Currently we are receiving about 100 tickets daily and a large amount of clients and everything seems to be fine (except massive closing tickets - for example - mass closing 80 tickets can take up to 30 seconds - is this still fine?).
in general the number of customers shouldn’t matter.
I know of Zammad-Systems with 3500 daily independent tickets. I’ve seen stress tests with even more workload that seem to be doing quite well. (any way we’re always fiddling and trying to improve and any point).
Closing operations for e.g. 80 Tickets might take some time. This has two reasons:
The overview is not updated “fast enough”
Zammad needs to wait for the database backend to write the changes and add background jobs (this kinda affects the first point)
Are you sure? Linux uses all available memory as cache, and that is absolutely fine and also very much what you want: https://www.linuxatemyram.com/
If you check your free -m output, you can see how much RAM is still available for applications to use (the last column “available” in the output). For example this server with 8 GB RAM may look like if it has only 660 MB free RAM, but it’s actually 3932 MB RAM that’s available:
server ~ # free -m
              total        used        free      shared  buff/cache   available
Mem:           8019        3624         660         363        3734        3932
Swap:             0           0           0
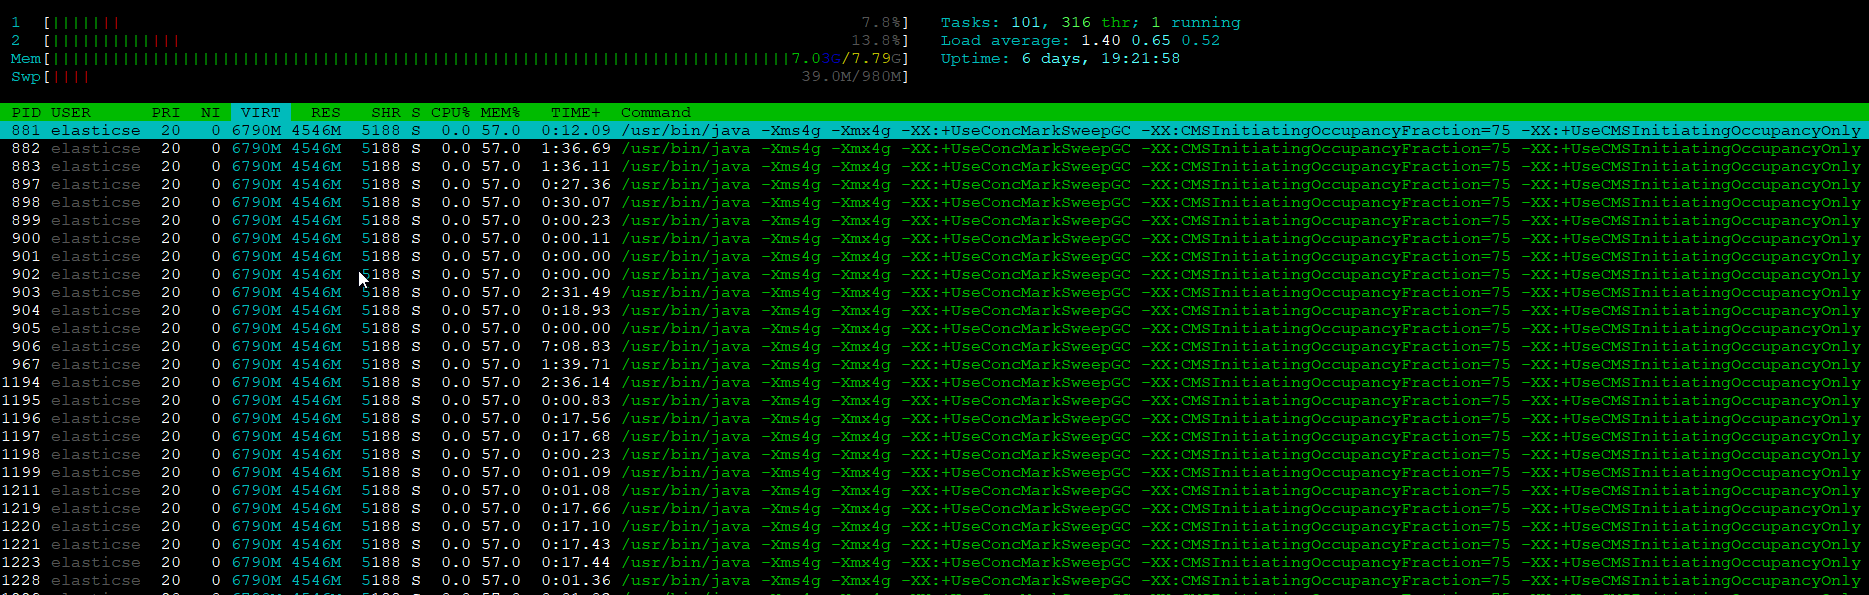
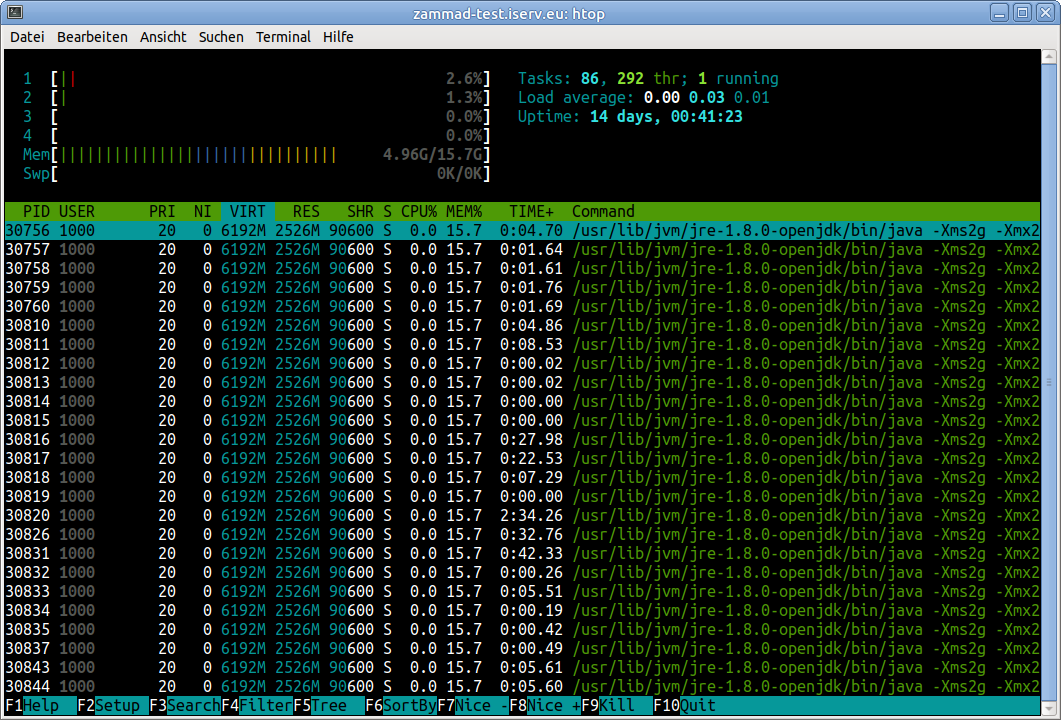
I think RES is the more relevant column here, so my ElasticSearch/Java seems to use ~2.5 GB, and yours seems to use ~4.5 GB. Sorted by RES, the next process is in the list is scheduler.rb with ~1.4 GB.
I don’t know much about Java, but those -Xms2g -Xmx2g options in my jvm processes vs. the -Xms4g -Xmx4g in your jvm process sound like they might be very relevant here. Maybe Java just allocates at least this much memory? Sure sounds like it:
The flag Xmx specifies the maximum memory allocation pool for a Java virtual machine (JVM), while Xms specifies the initial memory allocation pool.
This means that your JVM will be started with Xms amount of memory and will be able to use a maximum of Xmx amount of memory.
I’m using zammad-docker-compose, and as far as I can tell, these values aren’t explicitly configured by Zammad anywhere. 2 GB just seems to be the default of the ElasticSearch docker container as provided by ElasticSearch, and is configured in config/jvm.options in the image:
[elasticsearch@64c5253c5755 ~]$ cat config/jvm.options
## JVM configuration

################################################################
## IMPORTANT: JVM heap size
################################################################
##
## You should always set the min and max JVM heap
## size to the same value. For example, to set
## the heap to 4 GB, set:
##
## -Xms4g
## -Xmx4g
##
## See https://www.elastic.co/guide/en/elasticsearch/reference/current/heap-size.html
## for more information
##
################################################################

# Xms represents the initial size of total heap space
# Xmx represents the maximum size of total heap space

-Xms2g
-Xmx2g
[...]
Small side note as I begin seeing this more often:
Yes, elasticsearch tells you using half of the RAM available in your system for ES. But: please don’t forget that you’re running other services like postgresql and Zammad on the system!
Please think about lowering the RAM usuage for elasticsearch to at least 3GB (instead of 4) - I’d even go for 2 GB to ensure everything is fine.