Infos:
- Used Zammad version: zammad-3.0.0-15
- Used Zammad installation source: docker image / kubernetes
- Operating system: Various based on docker image Docker
- Browser + version: Firefox 68
Expected behavior:
- CPU usage would reflect our current agent usage.
Actual behavior:
- During off hours with no agents CPU usage does not recover until kubernetes pods are killed.
Steps to reproduce the behavior:
- Unknown
On several occasions we started seeing “Lost network connection” in the web ui. The errors lined up with high CPU on the scheduler and websocket pods. Looking at the container cpu usage showed some interesting patterns. The scheduler pod is orange and websockets green.
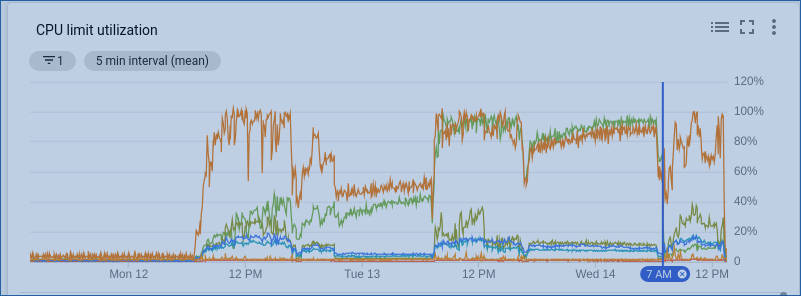
Over the weekend and evenings we have no agents using the system. You can see in that graph CPU picks up on Monday but never drops back down much below 60% even in the off hours. On Tuesday CPU usage hits almost 100% and never drops back down until I kill the pods at 7am Wednesday. After the pod restart the websocket pod never spikes above 50%.
I can increase cpu limits for the containers but it seemed odd that usage never drops back down even in off hours.
Any ideas how we can track down the root cause? I can open a github issue but I figured more specifics would be helpful.
Thanks!