GUI sometimes very slow, high CPU usage, closed tickets showing up as new

Infos:

  • Used Zammad version: 3.1.0
  • Used Zammad installation source: packager.io stable branch
  • Operating system: debian 9
  • Browser + version: current chrome, firefox, edge

Expected behavior:

  • Anything I do should happen without lag

Actual behavior:

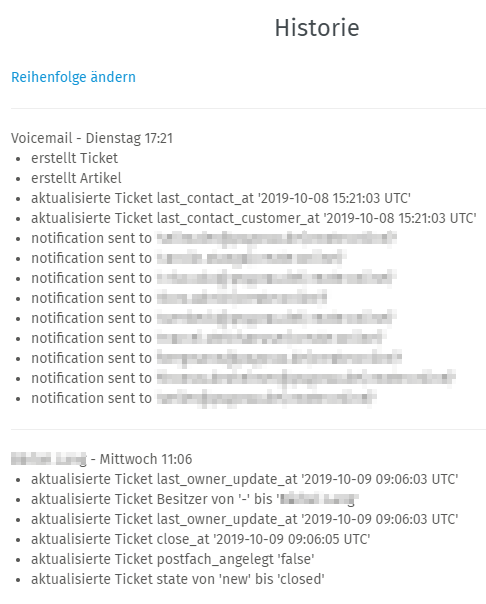
  • changing owner, changing state, changing group sometimes very slow.
    We have ~5-6 concurrent agents
    Our system specs: VMware vSphere Host machine with AMD EPYC 7351P, 128GB RAM, iSCSI Target: Synology FS1018 with 6 Samsung SM863a SSDs. Zammad VM has 4 cores, 24GB RAM, 50GB SSD. We are having 4x100% CPU load (each core 100%) 40-50% the time, especially when:
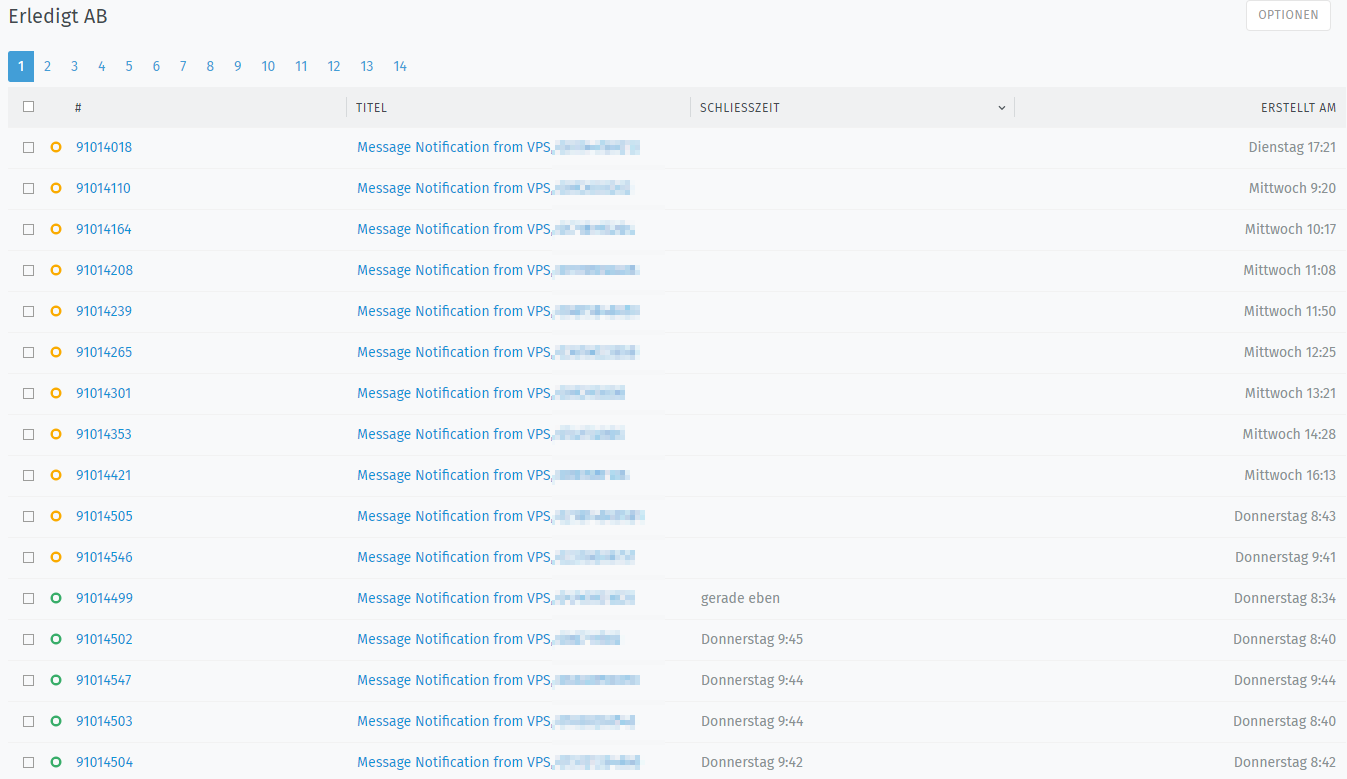
  1. new ticket is created via mail
  2. user is changing overview
  3. user is changing ticket state
  4. user is adding an article to a ticket
    etc
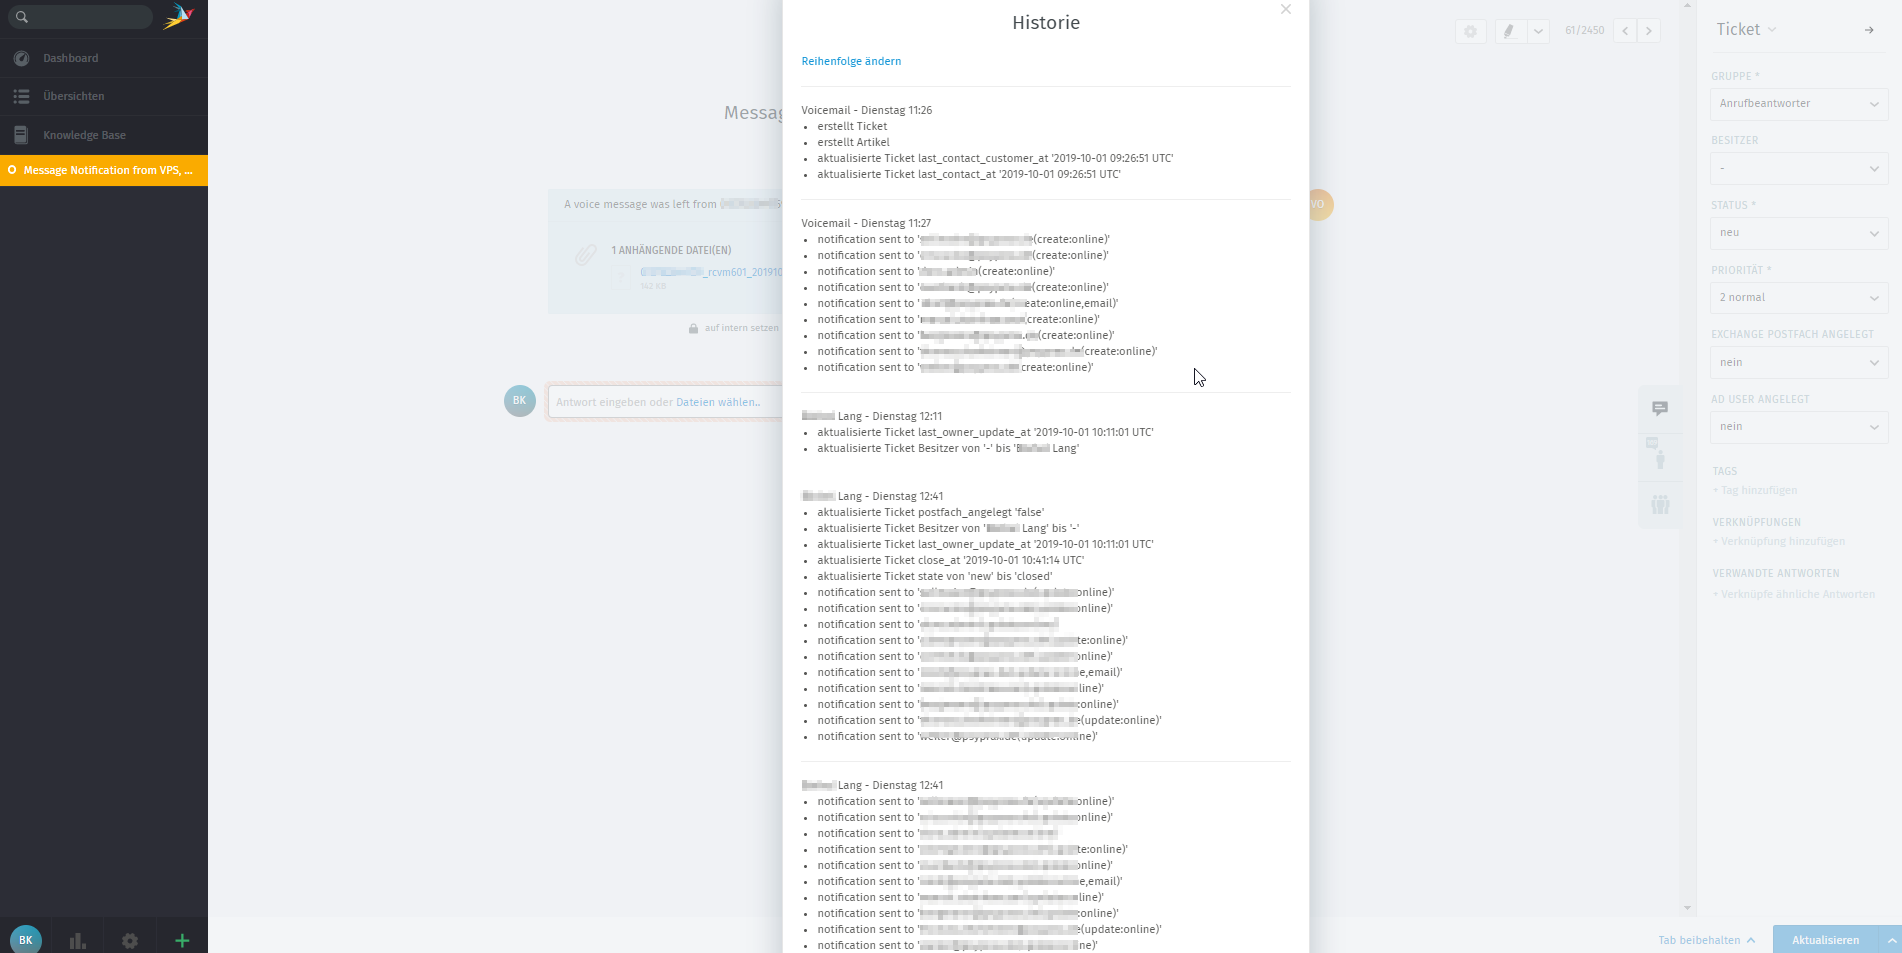
    everytime we have these “spikes” (lasting for 10-20 seconds), we have several ruby processes eating up 100% cpu time each.

We have set WEB_CONCURRENCY=4, that has helped a bit, after this we raised the DB connections because of timeouts. Also we have changed storage from DB to FS, this also boosted performance marginally.

Every time the system becomes sluggish, Delayed::Job.count raises to something like 200-300, jobs are slowly processed and when it is down at 100, system is responsive again.

Steps to reproduce the behavior:

  • use zammad :wink:
1 Like

Do I understand correctly, that you’re running Zammads storage on an Synology iSCSI?

More or less - the synology iSCSI is mounted as storage in vSphere and holds the vmdk files, but it’s connected with 10Gbe, and I have LOTS of IOPS (something like 50k random) and 5Gbps write speed, so that shouldn’t be the problem…

1 Like

Just a quite strange issue, this ticket is shown in overview “closed”, but history looks like this:

It seems as if the GUI needs some time to display all ticket states (in this case 2 hrs). I can not find anything to reproduce.
Strange thing is - this only happens with one particular agent

Here I grepped for that particular ticket number in production.log:

root@ticket:~# cat /var/log/zammad/production.log |grep '91011070'
I, [2019-10-01T14:22:21.726120 #32387-47231808056000]  INFO -- : Send notification to: 
idoit@customer.de (from:Ticketsystem customer GmbH <ticket@customer.de>/subject:Neues Ticket 
(Message Notification from VPS, CUSTOMERPHONE1) [Ticket#91011070])
I, [2019-10-01T14:27:00.968245 #32487-47451771571100]  INFO -- :   Parameters: 
{"number"=>"91011070", "title"=>"Message Notification from VPS, CUSTOMERPHONE1", "group_id"=>5, "owner_id"=>26, "customer_id"=>118, "state_id"=>1, "priority_id"=>2, "updated_at"=>"2019-10-01T12:22:04.485Z", "preferences"=>{"channel_id"=>4}, "pending_time"=>nil, "postfach_angelegt"=>nil, "user_angelegt"=>false, "id"=>"11657"}
I, [2019-10-01T14:27:53.058640 #32487-69867408081680]  INFO -- :   Parameters: {"number"=>"91011070", "title"=>"Message Notification from VPS, CUSTOMERPHONE2", "group_id"=>5, "owner_id"=>26, "customer_id"=>118, "state_id"=>1, "priority_id"=>2, "updated_at"=>"2019-10-01T12:27:01.270Z", "preferences"=>{"channel_id"=>4}, "pending_time"=>nil, "postfach_angelegt"=>nil, "user_angelegt"=>false, "id"=>"11657"}
I, [2019-10-01T14:28:09.222633 #32475-69867744288580]  INFO -- :   Parameters: {"number"=>"91011070", "title"=>"Message Notification from VPS, CUSTOMERPHONE2", "group_id"=>"5", "owner_id"=>"26", "customer_id"=>118, "state_id"=>"4", "priority_id"=>"2", "updated_at"=>"2019-10-01T12:27:53.083Z", "preferences"=>{"channel_id"=>4}, "pending_time"=>nil, "postfach_angelegt"=>false, "user_angelegt"=>false, "id"=>"11657", "all"=>"true"}

Here we have 2 different emails that became one ticket, if I see this correct (i replaced the phone number in the title with CUSTOMERPHONE1 and CUSTOMERPHONE2)

I am really confused :confused:

If this only happens to one agent, you might want to check the local machine of the user.
Proberbly he has a buttload of tabs open on the left side (ticket tabs) which will slow down the Browser drastically.

The mentioned specs should be fair enough, even though I’m having a bad stomache feeling about the iSCI - however, I trust you if you say write and read speed shouldn’t be a problem.

It would be very interesting to know what exactly these delayed Jobs are about - like so:

Delayed::Job.first.handler
Delayed::Job.second.handler
Delayed::Job.third.handler

Is it about sending mails or is it about searchindexing?

This will help us for the direction to look for.

Sidenote from my personal experiences: Whenever I had to deal with Synology iSCSI and vmware, I found these to be extremly slow (even if the network around it is well fast enough and stuff). This experience is a bit older by now, so this might have improved. Just for you to understand where my bad stomache comes from. :wink:

Having this strange issue right now without any delayed jobs - closed tickets appear as “new” in an overview that only contains closed tickets. Also when I open the ticket, it seems to be “new”, but it was closed already by an agent.


image
I just took the first ticket, that’s showing up when I open the ticket history:

Any clue? Delayed::Job.count shows 0… This does happen with several agents, all having maybe 2 or 3 tickets in their left sidebar…

that’s the overview:

When I close the tickets “again”, they show up as closed, but with a very funny history:

Your overviews on the left side would interest me far more.
Looks like you’re putting your scheduler on high load with too many overviews and too many tickets.
Your one screen shows at least 2100 Tickets which mostly are all closed. Is this really neceasary?

Please reduce your overviews to 15-20, try to make them as universal as possible and try to avoid big overviews. In my opinion you don’t need to have an overview that shows your closed tickets - if you do, you might want to limit the entries to the last n days and -if older- use the search function instead.

(see: https://admin-docs.zammad.org/en/latest/manage-overviews.html )

Thanks - see screenshot above - the overview “Erledigt AB” is for the last 7 days only… Changed this to last 2 days now, the overview contains ~1000 tickets. Normally this will contain ~300 tickets… Maybe this will reduce load.
Gonna check what happens next…

1 Like

After one week with reduced overviews we still have the problem, that sometimes closed tickets show up as new in GUI, but when I check the tickets’ history, it is closed. We then had the situation, that that particular person always complaining about this was on vacation for 2 days, and boom! the problem was gone. Now she’s back, and the issue is back.
She can’t tell what she is doing different from the others… I have no clue either. Is it a layer 8 problem or can it be anything technical in zammad?

Does this only affect one person?
If so, you might want to ensure that the user does not have more than 30 tabs opened within Zammad.

If the user has more, this will likely be your problem.
This should pair up with high CPU usuage of the users browser on the client.

Technically this is a client / layer8 issue, because the workload gets too much for the Browser.
This is the reason why we limit objects you can retrieve within Zammad.

This issue mostly happens, if you update ticket attributes and the user has tabs opened.
Normally Zammad removes the oldest tab to make room for a new one, but not if you have 30 tickets with “edit” state. Zammad won’t and can’t decide if the “edit/draft” may be discarded or not.

This does only affect one person, yes. Everyone has 1 or 2 tickets open in the left sidebar, so that can’t be an issue. We tested firefox and chrome to exclude the local browser from being a problem. The users are instructed to only work on one ticket at a time: they are only listening to voicemails (open ticket, ticket is auto-assigned, download .wav attachment, listen to it, write down what is happening in another system, close ticket with a macro that closes the ticket and closes the tab).
veeeeery strange issue all this, I can’t really understand how it happens…

Does this issue still appear if the same user does change the machine and/or location?

We need to try that, didn’t have the chance yet. Thanks for the hint though, nearly forgot about that…

1 Like

Tried with another machine - same.
We had other users with the same issue now, but not as frequent as that particular user, found out why: she’s working quicker and closes more tickets…
So this seems to be a general issue.
We checked that nobody has more than 2 or 3 tickets showing up in their left column (most only have the current ticket showing up). To say it like Hubert Aiwanger or GĂĽnther Oettinger: I am with my latin on the end :wink:

Thanks

Babak

Could you please check if these users are members of organizations? If so, do the following for some stat-magic:

zammad run rails r "p User.where(organization_id: User.find_by(email: '{affected-users-mail}').organization_id).count"

The above will check how many users are inside your organization.
It’s possible that you’re affected by the following:

This might also affect the agent, if the customer is member of a fairly big organization.
This would also explain why your delayed-job count jumps up so high “instantly”.

Thanks!

Tried it, but get an error message:

irb(main):001:0>p User.where(organization_id: User.find_by(email: '{affected.user@domain.tld}').organization_id).count" Traceback (most recent call last): 1: from (irb):1 NoMethodError (undefined method 'organization_id' for nil:NilClass)

then tried
irb(main):001:0>p User.where(organization_id: User.find_by(email: '{affected.user@domain.tld}')).count"

Gives me a count of 28

Then tried
irb(main):001:0>p User.where(organization_id: User.find_by(email: '{affected.user@domain.tld}').organization_id)"

Shows me users which are not tied to an organization (organization_id: nil). The affected user though is member of an organization.

The organization has something like 60 members. All agents are member of this organization, and also the voicemail is member of this organization.

There are no SLAs defined

This phenomenon seems to happen as soon as the ticket count is raising. As of now, something like 1 ticket every few minutes are created, and the issue isn’t showing up. Some weeks ago, there were 3 or 4 new tickets every minute, and the issue started showing up…

I believe that you’re -at least partly- affected by the following Bug:

Currently the only option to reduce the load in this concern is to remove the agents from Organizations.
This can make a difference.

Still odd, because somewhat 6 concurrent agents with 2-4 updates per second shouldn’t be such a big deal to be honest.

This topic was automatically closed 120 days after the last reply. New replies are no longer allowed.