Infos:
- Used Zammad version: 5.2
- Used Zammad installation type: package
- Operating system: Ubuntu 20.04.5 LTS
- Browser + version: Edge 105.0.1343.27
- Elastic Search: 7.17.6
- Grafana OSS: 9.1.2
Expected behavior:
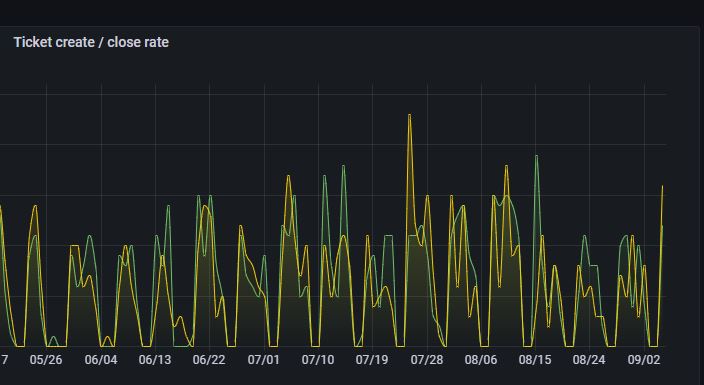
Grafana Panel created / closed shows ticket count
Actual behavior:
Zero Tickets are displayed

Steps to reproduce the behavior:
- Import Grafana Dashboard from Github: GitHub - zammad/grafana-dashboards: This repository contains sample Dashboards for Zammad to help you with a quick start.
- Setup ES Datasources
The Tickets created / closed graph is working but the single panels not.
Graph Settings:
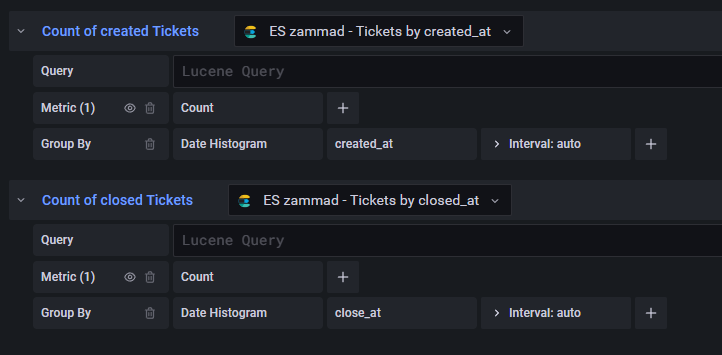
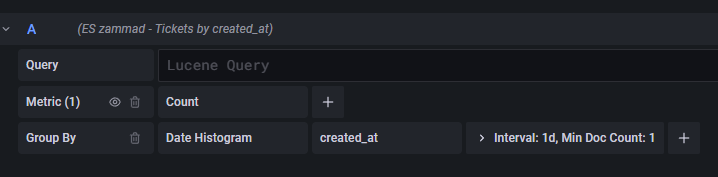
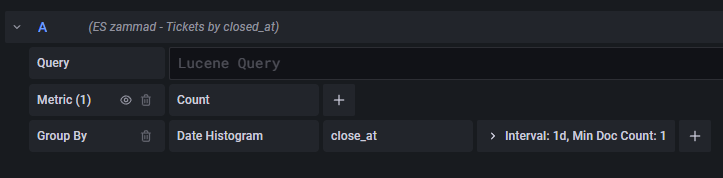
Panel Settings:
Am I missing something?