Infos:
- Used Zammad version: 5.2.1
- Used Zammad installation type: package
- Operating system: Ubuntu 18.04.6
- Browser + version: 91.12.0esr (64-Bit)
Expected behavior:
The Statistics field should display according to the template
*
Actual behavior:
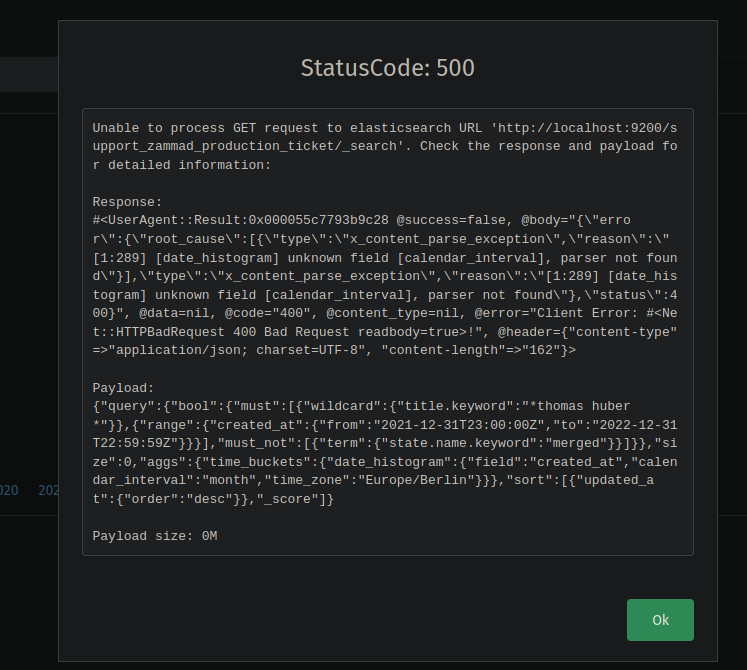
A error 500 with the following message gets displayed:
Unable to process GET request to elasticsearch URL 'http://localhost:9200/support_zammad_production_ticket/_search'. Check the response and payload for detailed information:

Response:
#<UserAgent::Result:0x000055c7793b9c28 @success=false, @body="{\"error\":{\"root_cause\":[{\"type\":\"x_content_parse_exception\",\"reason\":\"[1:289] [date_histogram] unknown field [calendar_interval], parser not found\"}],\"type\":\"x_content_parse_exception\",\"reason\":\"[1:289] [date_histogram] unknown field [calendar_interval], parser not found\"},\"status\":400}", @data=nil, @code="400", @content_type=nil, @error="Client Error: #<Net::HTTPBadRequest 400 Bad Request readbody=true>!", @header={"content-type"=>"application/json; charset=UTF-8", "content-length"=>"162"}>

Payload:
{"query":{"bool":{"must":[{"wildcard":{"title.keyword":"*thomas huber*"}},{"range":{"created_at":{"from":"2021-12-31T23:00:00Z","to":"2022-12-31T22:59:59Z"}}}],"must_not":[{"term":{"state.name.keyword":"merged"}}]}},"size":0,"aggs":{"time_buckets":{"date_histogram":{"field":"created_at","calendar_interval":"month","time_zone":"Europe/Berlin"}}},"sort":[{"updated_at":{"order":"desc"}},"_score"]}

Payload size: 0M
Steps to reproduce the behavior:
Unknown
*
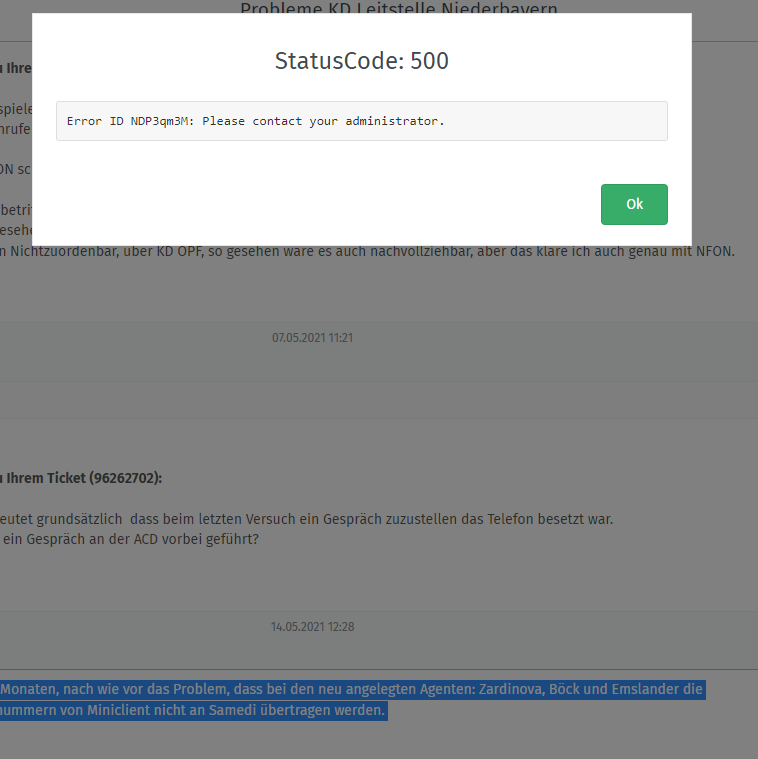
I do not know if this is related but a customer reported the following behavior in one ticket:
I could not locate the errror in a log file
I searched the follwing files:
Syslog
Nginx logs
Elastic search logs
Could some one please advise what the next steps are?