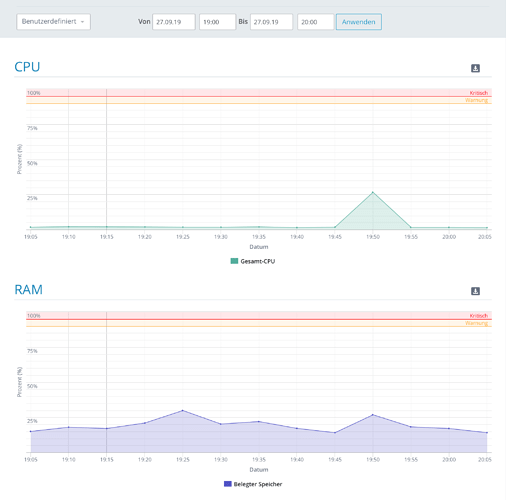
Thanks for the help so far. After I restarted Elasticsearch this morning, Zammad worked fine all day. Tonight, almost exactly 24 hours later, the same happened again. I have had any kind of error with Elasticsearch only 1-2 times before and in the past, it always was related to updates or at least something done to the server.
Yesterday and today or even the complete past week, nothing was done on the server. No updates or whatsoever. The server is only used for Zammad.
What happens at 19:49 h is the daily backup through “Acronis Anydata” (Standard Backup solution for 1&1/ionos Cloud Server). But the backup console doesn’t show any errors and the monitoring of 1&1/ionos does not show any alerts for CPU or RAM.
Same error message today:
● elasticsearch.service - Elasticsearch
   Loaded: loaded (/usr/lib/systemd/system/elasticsearch.service; enabled; vendor preset: disabled)
   Active: failed (Result: signal) since Fr 2019-09-27 19:49:08 CEST; 1h 29min ago
     Docs: http://www.elastic.co
  Process: 51137 ExecStart=/usr/share/elasticsearch/bin/elasticsearch -p ${PID_DIR}/elasticsearch.pid --quiet -Edefault.path.logs=${LOG_DIR} -Edefault.path.data=${DATA_DIR} -Edefault.path.conf=${CONF_DIR} (code=killed, signal=KILL)
  Process: 51135 ExecStartPre=/usr/share/elasticsearch/bin/elasticsearch-systemd-pre-exec (code=exited, status=0/SUCCESS)
 Main PID: 51137 (code=killed, signal=KILL)

Sep 27 07:36:54 zammad systemd[1]: Starting Elasticsearch...
Sep 27 07:36:54 zammad systemd[1]: Started Elasticsearch.
Sep 27 19:49:08 zammad systemd[1]: elasticsearch.service: main process exited, code=killed, status=9/KILL
Sep 27 19:49:08 zammad systemd[1]: Unit elasticsearch.service entered failed state.
Sep 27 19:49:08 zammad systemd[1]: elasticsearch.service failed.
If I run less /var/log/elasticsearch/elasticsearch.log and go to the end (with “G”) it doesn’t show any entries around that time. The latest entries are from several hours before.
[2019-09-27T11:33:09,658][WARN ][o.a.p.p.f.PDType1Font    ] Using fallback font LiberationSans for Helvetica-Bold
[2019-09-27T11:33:09,673][WARN ][o.a.p.p.f.PDType1Font    ] Using fallback font LiberationSans for Helvetica
[2019-09-27T11:33:09,673][WARN ][o.a.p.p.f.PDType1Font    ] Using fallback font LiberationSans for Helvetica-Bold
[2019-09-27T11:33:10,534][INFO ][o.e.m.j.JvmGcMonitorService] [TNWfDTe] [gc][young][14131][53] duration [800ms], collections [1]/[1.4s], total [800ms]/[18.5s], memory [171.5mb]->[185.6mb]/[1.9gb], all_pools {[young] [524.4kb]->[732.3kb]/[133.1mb]}{[survivor] [16.6mb]->[16.6mb]/[16.6mb]}{[old] [154.4mb]->[168.3mb]/[1.8gb]}
[2019-09-27T11:33:10,558][WARN ][o.e.m.j.JvmGcMonitorService] [TNWfDTe] [gc][14131] overhead, spent [800ms] collecting in the last [1.4s]
[2019-09-27T11:34:42,587][INFO ][o.e.m.j.JvmGcMonitorService] [TNWfDTe] [gc][14223] overhead, spent [251ms] collecting in the last [1s]
[2019-09-27T12:44:24,903][WARN ][o.e.m.j.JvmGcMonitorService] [TNWfDTe] [gc][18404] overhead, spent [726ms] collecting in the last [1.2s]
The error must have something to do with the backup process. But I don’t know what to check.
I will restart Elasticsearch again and than see what happens tomorrow night. I will probably get the same error tomorrow and might restart the server completely. But many thanks upfront if anyone has a tip what to check.
Thanks,
Gijs
