Determine average processing time using Grafana

Infos:

  • Used Zammad version: 5.0.x
  • Used Zammad installation type: docker-compose

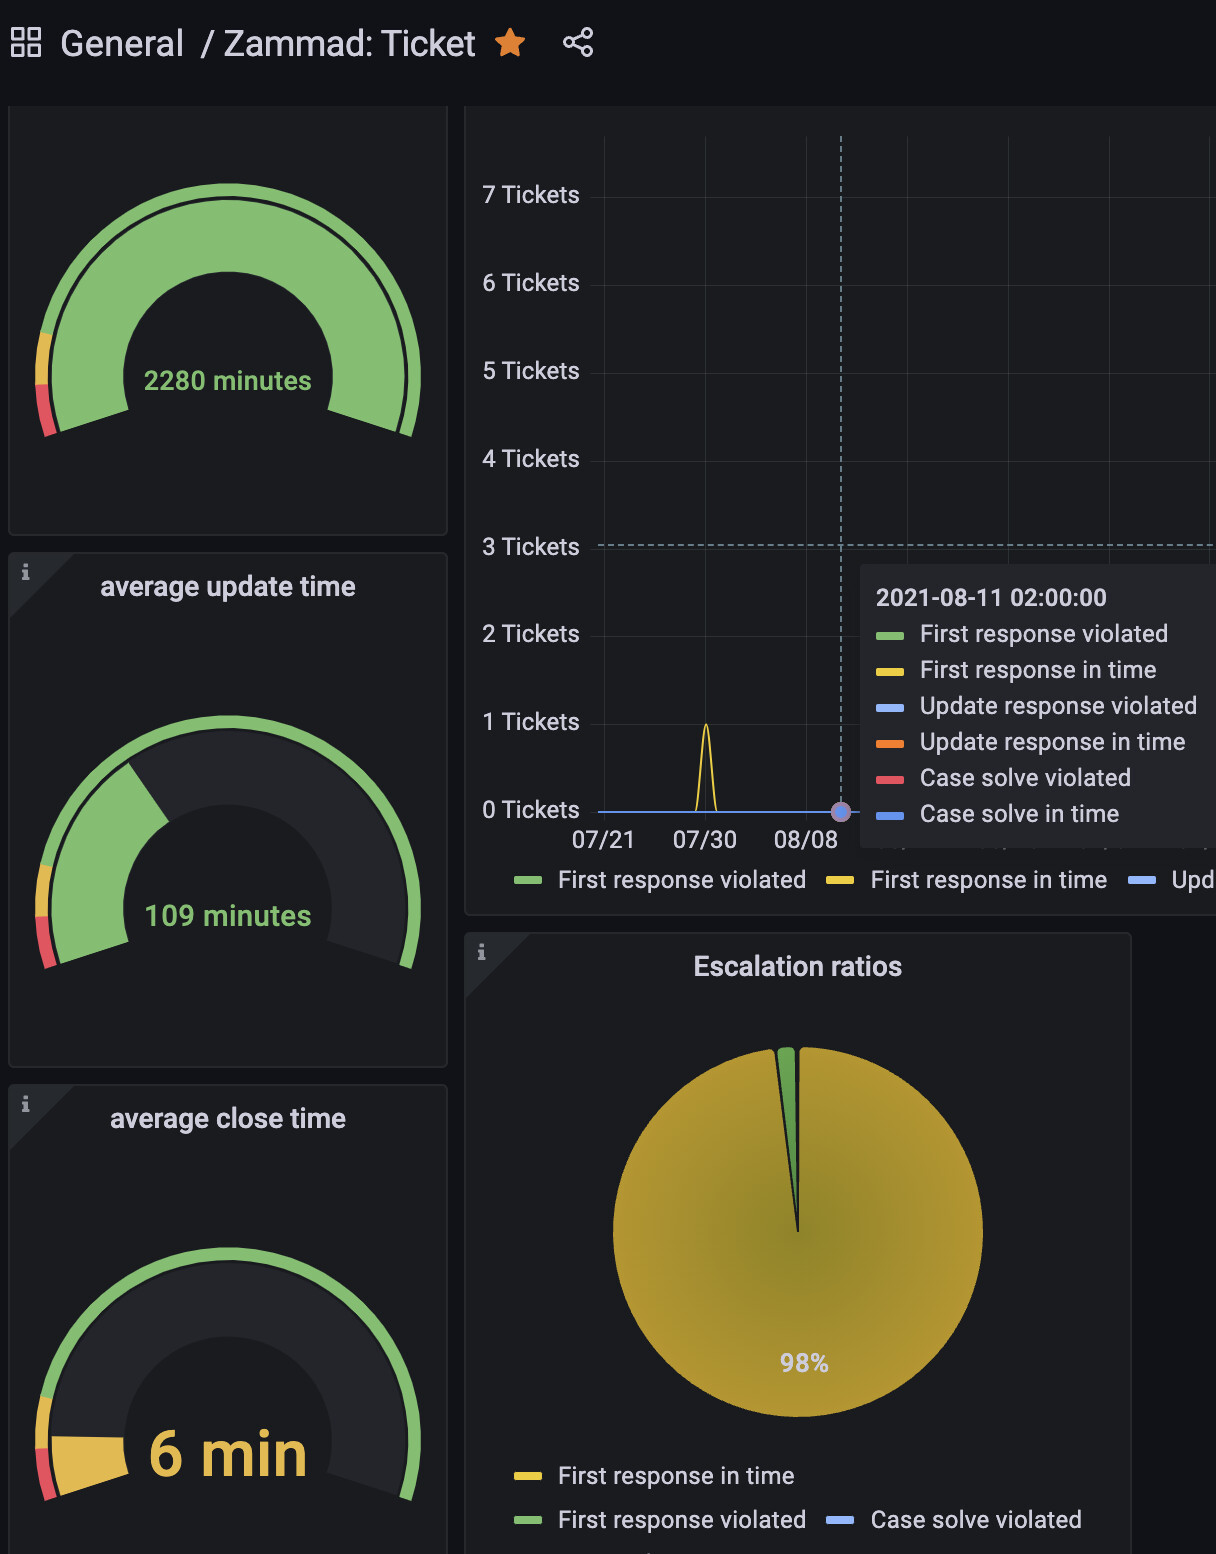
Can someone help us with an analysis in Grafana? We are interested to get the average processing time of a ticket and the average processing time between ticket creation and the first reaction.

Which fields need to be addressed?
Which data source should be used?
Which options and settings have to be made in Grafana?

We apologize if this isn’t the right place.

Hi,
in the default dashboards there are this three panels, i’m not sure if this is what you are looking for:

2 Likes

In addition if you want tomorrow there’ll be a free webinar tomorrow about reporting with grafana!

1 Like

Awesome, thanks for the info!

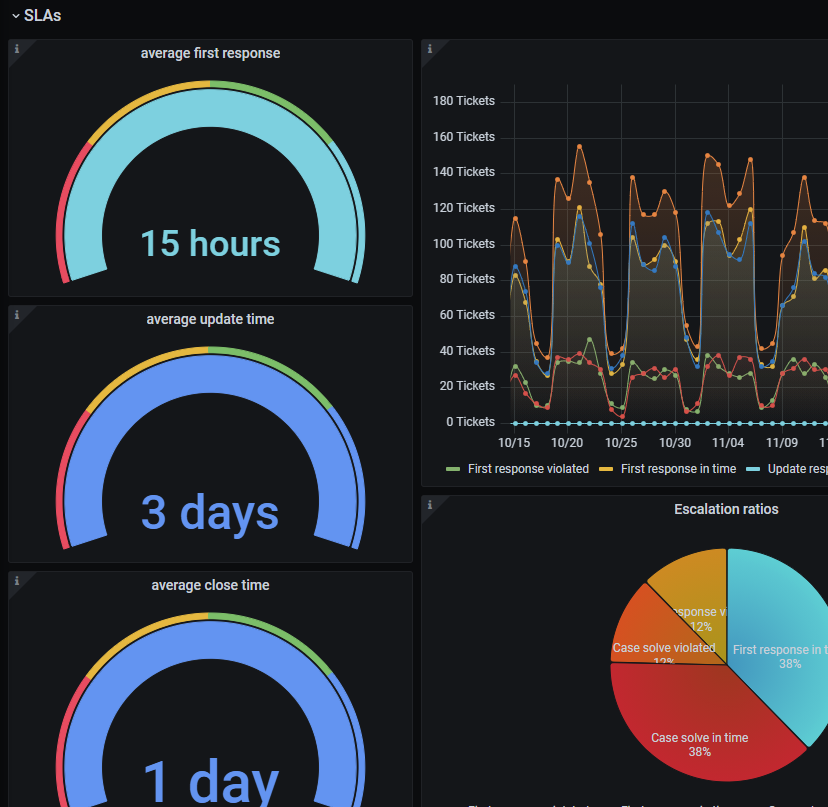
The only thing that i still have it to figure out is: does this data rely only on SLA?
In other words, if the a SLA is not set for a group, will it work?

The dashboard parts are living in the sub category SLAs.
So yes, average solving time etc requires SLA calculations.

1 Like

This topic was automatically closed 120 days after the last reply. New replies are no longer allowed.