Creating Number fo Open Tickets Panel in Grafana

  • Used Zammad version:
    4.1.x

  • Used Zammad installation type: (source, package, docker-compose, …)
    Package

  • Operating system:
    Debian Buster (10)

  • Browser + version:
    N/A

We have Zammad installation with ElasticSearch install and configured.
We are testing Grafana reporting, and have an example dashboard setup as per GitHub - zammad/grafana-dashboards: This repository contains sample Dashboards for Zammad to help you with a quick start.

Unfortunately, the Dashboard is missing a panel we would like to have on our Dashboard:

Open Tickets

This would show the total number of current open tickets in a similar format to the existing Tickets Created and Tickets Closed panels.

However, I cannot seem to find an appropriate Timefield to use for the data source.

On a similar note, we’d also like to have a panel showing the total number of created tickets since the beginning of time.

Any help is appreciated.

Hey Anetis,

duplicate the existing and closed Ticket Panel.
Edit the Panel and go to the Tab “Transform” → Add Transforamtion.
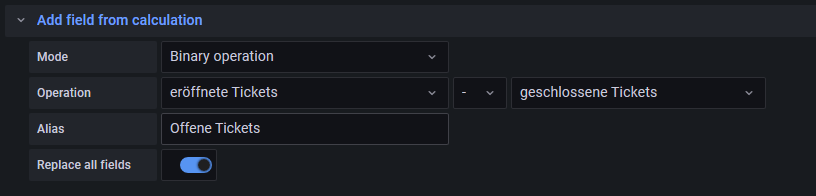
Now add “Add field from caluclation” take the Mode “Binary operation”
Now you can calculate the difference between existing and closed Panels :slight_smile:

This will look like that:

Hint: If you want to filter the Tickets for an certain group from Zammad add this to the querys.
group.name: [your group]

Apologies for the delay in replying. Got busy with a few other things.
Do I need to set up a new Data source because I tried this and it didn’t work. The only fields I can choose from are Time and Count.

We are using the example default template dashboard from GitHub - zammad/grafana-dashboards: This repository contains sample Dashboards for Zammad to help you with a quick start.

The current panels for open and closed tickets are on a 1 day timer (last 24 hours). I really don’t want to work from the existing panels.

I want to show a total of open tickets (i.e. created_at - close_at).

While I get your approach it’s not exactly possible with Grafana if you want to have exact numbers.
The reason for that is that your approach expects all tickets in the timespan you’re looking at always to be closed in time.

A simple sum up of all open tickets should be enough. However, as I mentioned above, it’s far from perfect.

Nevermind. I figured a way around the limitations of ElasticSearch. Just connect Grafana to the Zammad DB directly via the Postgresql connection.
Now I can do what I need to directly in Grafana using SQL statements and views.

This topic was automatically closed 120 days after the last reply. New replies are no longer allowed.