Hi, ever since upgrading to 5.3 with the new bitnami elasticsearch container we are facing daily problems.
Let me first provide the details of our setup
Used Zammad version: 5.3.0-9
Used Zammad installation type: docker-compose
Operating system: Debian 10
Browser + version: Brave / Chrome / Not relevant
Server RAM: 24GB
CPU Cores: 12
Tickets in System: almost 100.000
Expected behavior:
elasticsearch not killing the machine.
Actual behavior:
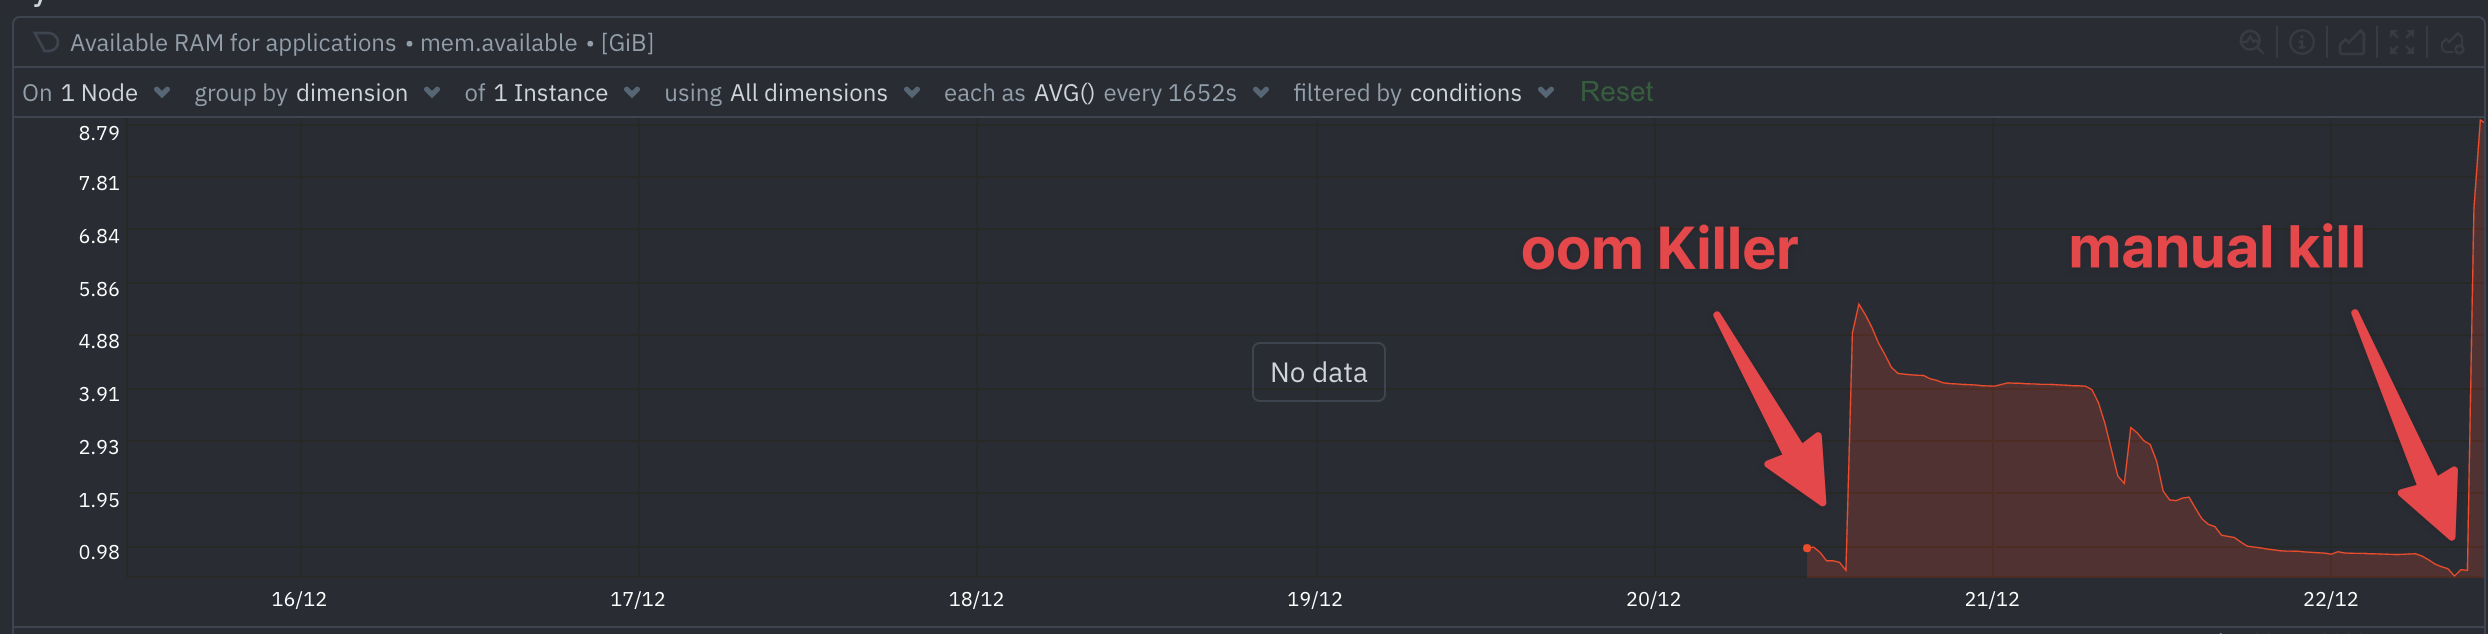
Elasticsearch runs rampage and either drags the whole system down or is eventually killed by oom killer.
With the pre 5.3 version of Zammad and the compose setup using the zammad own packaged elasticsearch, we provided these settings and it was running great
As it turned out (yes I should have RTFM first) the bitnami uses the env var ELASTICSEARCH_HEAP_SIZE but according to the docs it defaults to 1024M which is way lower than what we used to have. So I am puzzled about why elasticsearch still kills the machine.
I have now started it with "ELASTICSEARCH_HEAP_SIZE=4096m" and waiting to see what happens.
I checked the java command starting elasticsearch and the correct setting for Xms4096m and -Xmx4096m where used.
Elasticsearch by default takes up to 50% of your available memory.
Due to how docker works, this is potentially a lot of memory.
Either use the heap size settings (that’s what the setting is there for) or limit the container - I’d personally prefer option 1 to really only use what you need.
I am using the heap setting. Looking a bit further into it, it seems the issue is a bit more complex.
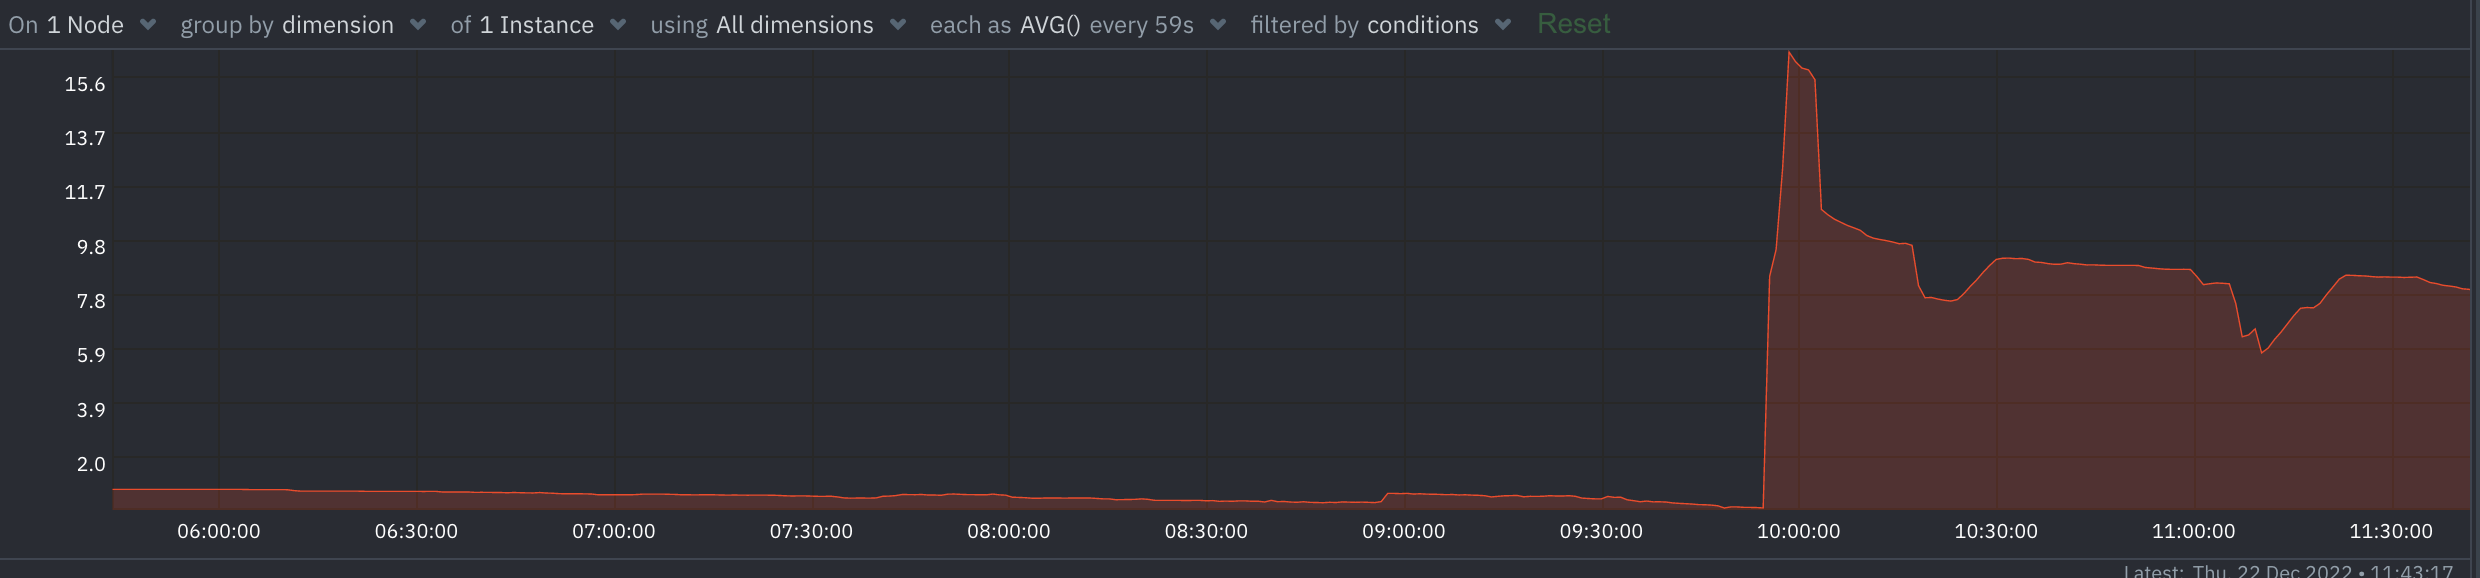
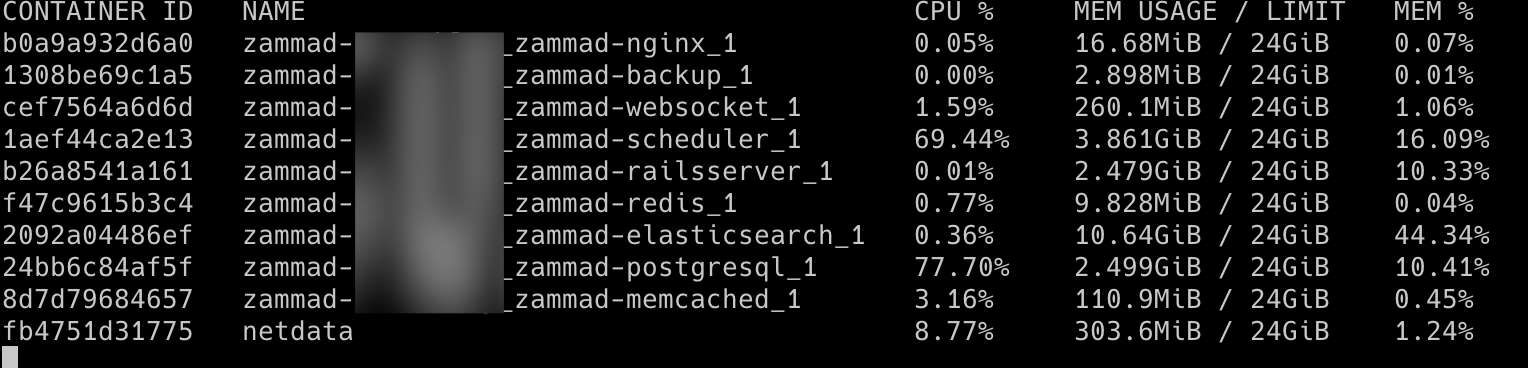
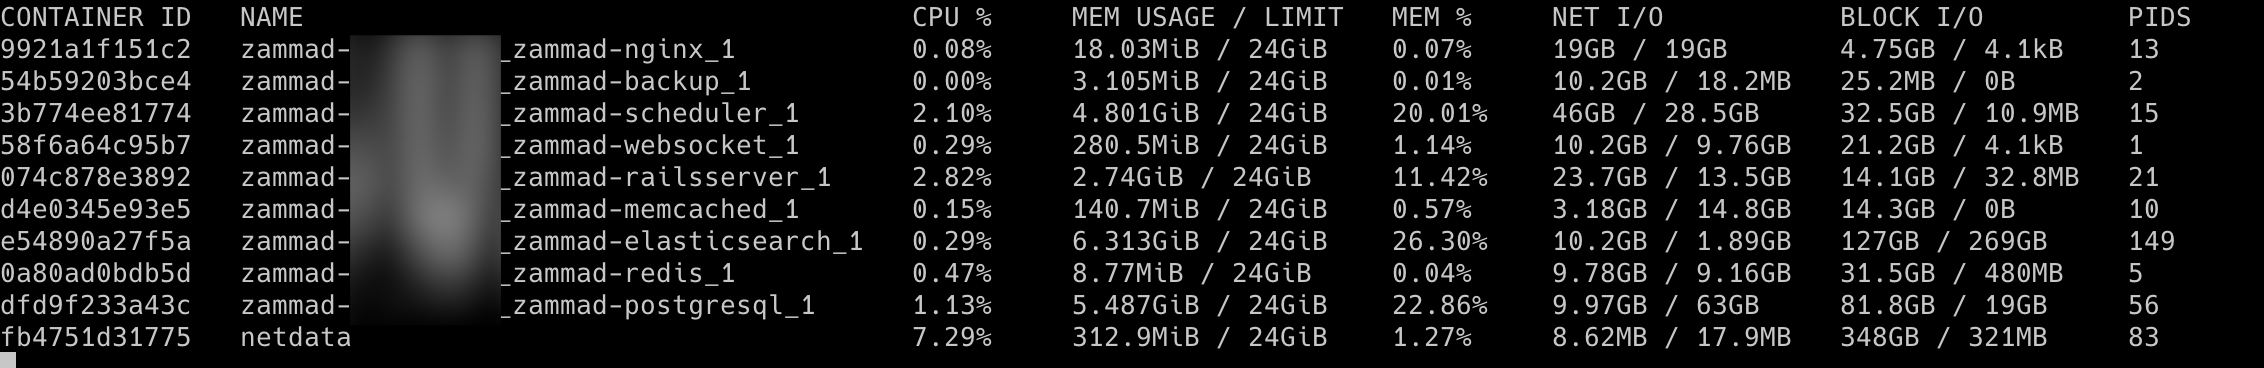
it seems the scheduler is also using about 16% of RAM and it just keeps increassing until restarted.
I will decrease the heap thing from 8gb to 4gb and see what happens then. Not sure if it’s just the sheer amount of tickets or what happened after the upgrade. We did occasionally have some RAM full issues with 4.x but since 5.x the OOM Killer comes at least once a day.
The Limiting docker container only works with swarm mode as far as I could see it or using docker-compose file in an older version. I’m not that fit in that matter, I would have to experiment a bit.
You can reduce Elasticsearch to 2-4GB if you please. 10GB especially in your setup may be too much.
As for the scheduler container, did you enable any performance tunings? Usually this high memory usage would come either from ages of running (which you of course don’t do because you update regularily :)) or a lot of concurrent processes inside the container.
I’ve reduced it to 4 and so far, no oomkiller anymore.
Ages of running wasn’t even possible since I mostly restarted the whole thing several times a week.
The only other settings I have are these:
I’ve just checked, they are up since 04. January, so exactly one week.
We have no custom schedulers,
all I can see in the logs are these
I, [2023-01-04T21:27:08.184850 #1-112000]  INFO -- : Running job thread for 'Check 'Channel' streams.' (Channel.stream) status is: sleep
I, [2023-01-04T21:27:08.184891 #1-112000]  INFO -- : Running job thread for 'Process ticket escalations.' (Ticket.process_escalation) status is: sleep
I, [2023-01-04T21:27:08.184919 #1-112000]  INFO -- : Running job thread for 'Check channels.' (Channel.fetch) status is: sleep
I, [2023-01-04T21:27:08.184988 #1-112000]  INFO -- : Running job thread for 'Generate 'Session' data.' (Sessions.jobs) status is: sleep
I, [2023-01-04T21:27:08.185969 #1-112000]  INFO -- : Running job thread for 'Execute planned jobs.' (Job.run) status is: sleep
and some SessionTimeoutJob removed session and the IMAP fetches.
this is the memory usage since it was freshly started.
We have the first dip on Thursday, still a lot of people on holiday, then stable Friday - Sunday since Friday was public holiday, Saturday + Sunday nobody worked.
Then follows the next dip on Monday as soon as agents start working, next dip is on Tuesday when agents start working, the dip today morning wasn’t that big however. Let’s see what happens tomorrow.
We are aware of some instance (this is fairly rare) that ramp up their memory, even in fairly short time.
I cannot provide community powered debugging - also due to the fact that you’re using docker which could be an issue during debug.
I am aware that’s not the answer you’re looking for. Instead of ghosting you I wanted to transparent on this and hope that you can understand. For the time being, I’m afraid, “patience” is all I can ask for. Our developers are investigating instances that are under support and so this might be found sooner or later.
And just to be very clear: This is not a docker specific issue but may affect potentially all installation types - just in case above statement raises this thought.
Thanks, and no worries. I get it.
My goal is to have it running smoothly, if it keeps at this current rate of keeping 1-3 GB free RAM an no OOM Killer rampaging, I’m fine with that.
So far it’s still up, with about 4GB Free RAM, no oom killer. If we get an alert 1x per Month of RAM usage and we have to restart, that’s fine.
But the 3-4x per Week where a bit brutal