-
Used Zammad version: 7.0.0-1774032954.b35be827.bookworm
-
Used Zammad installation type: package
-
Operating system: Debian 12
-
Browser + version: newest Chrome
ii elasticsearch 9.3.2 amd64 Distributed RESTful search engine built for the cloud
ii memcached 1.6.18-1 amd64 High-performance in-memory object caching system
ii nginx 1.22.1-9+deb12u4 amd64 small, powerful, scalable web/proxy server
ii nginx-common 1.22.1-9+deb12u4 all small, powerful, scalable web/proxy server - common files
ii postgresql 15+248+deb12u1 all object-relational SQL database (supported version)
ii postgresql-15 15.16-0+deb12u1 amd64 The World’s Most Advanced Open Source Relational Database
ii postgresql-client-15 15.16-0+deb12u1 amd64 front-end programs for PostgreSQL 15
ii postgresql-client-common 248+deb12u1 all manager for multiple PostgreSQL client versions
ii postgresql-common 248+deb12u1 all PostgreSQL database-cluster manager
ii redis-server 5:7.0.15-1~deb12u6 amd64 Persistent key-value database with network interface
ii redis-tools 5:7.0.15-1~deb12u6 amd64 Persistent key-value database with network interface (client)
},
“Environment”: {
“RAILS_LOG_TO_STDOUT”: false,
“ZAMMAD_SAFE_MODE”: false,
“ZAMMAD_RAILS_PORT”: false,
“ZAMMAD_WEBSOCKET_PORT”: false,
“WEB_CONCURRENCY”: “4”,
“ZAMMAD_PROCESS_SESSIONS_JOBS_WORKERS”: “2”,
“ZAMMAD_PROCESS_SCHEDULED_JOBS_WORKERS”: “1”,
“ZAMMAD_PROCESS_DELAYED_JOBS_WORKERS”: “2”,
“ZAMMAD_SESSION_JOBS_CONCURRENT”: “2”
},
“FailedEmails”: 0,
“Hardware”: {
“total_memory”: 92793946112,
“cpu_cores”: 10,
“app_disk_space”: {
“total”: 1,
“used”: 204852976,
“free”: 151972392
Expected behavior:
When using AI operations such as triggers or ticket summaries, zammad-web-1 should process the request normally and CPU usage should stay within a reasonable range.
Actual behavior:
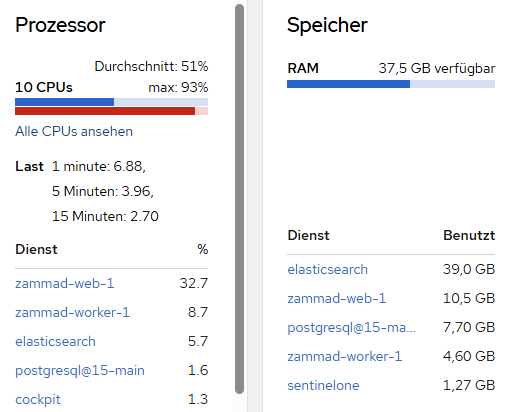
Whenever these AI operations are executed, CPU usage on zammad-web-1 jumps dramatically. The spike happens immediately once the feature is used and seems directly related to the AI processing.
The issue is reproducible. In normal operation, without AI actions, zammad-web-1 does not show this kind of CPU usage.
Steps to reproduce the behavior:
- Configure Zammad to use Ollama for AI features.
- Open any ticket.
- Run an AI operation such as ticket summarization or an AI-triggered action.
- Check the resource usage of
zammad-web-1.
- CPU usage spikes significantly as soon as the AI operation starts.
If AI gets triggered
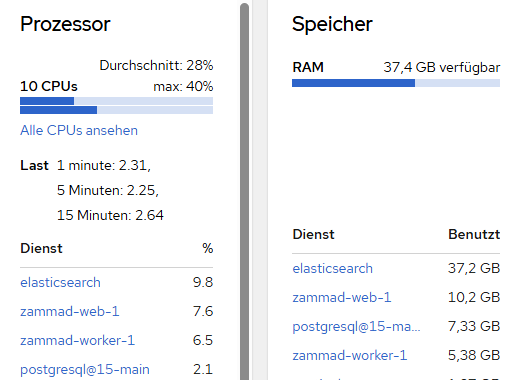
If there is no AI operation
A example:
Even a simple trigger like this seems to create enough load to bring a 10-core system to its knees.
Hi @Adrian0514.
Are you using ollama on the same local machine or are you targeting a remote system?
Ollama ist running on a remote maschine.
Is your WebSocket server running fine?
Normally, the most AI stuff is executed inside a background worker job, so unrelated to the web-process.
There is a commit coming which might be related:
maybe you can wait for the build and update to see if it has any impact for you.
Imo CPU spikes like this should show up on SaaS and its monitoring too if it‘s a problem. That is if customers are using it - 7.0 instances then should show higher loads on the systems in general. At least theoretically.
Would also be interesting if it’s really only related to AI actions or also other triggers that are doing some stuff or different situations.
I would think this related commit will not really influence the AI situation.
The ticket index was recreated around 10 days ago, and since then about 1.91 TB has already been processed through index merges. I do not have proper comparison values yet, but with around 60 users working at the same time, I can see more or less permanent disk write activity of around 30 MB/s.
What also looks strange to me is that this already seems quite high for a volume of only around 200–300 tickets per day. Based on that ticket volume, I would not have expected this kind of write load and merge activity.
The zammad-web CPU issue only happens under load**, not while the system is idle. So my current assumption is that something under productive usage is pushing Elasticsearch much harder than expected, also even if there are no Users logged in and nearly 0 Tickets arrive, Elastic still looks way to busy.
I already double-checked triggers, automations and similar things for bad configurations or loop situations, but from what I have seen so far, they are all built quite specifically and filtered well. At the moment, they do not look like the main reason.
Another important point is that the problem started after the update to Zammad 7. In the same maintenance window, Elasticsearch was also updated from version 7 to version 9. So right now it is hard to say if the change came from Zammad itself, from the Elasticsearch upgrade, or from the combination of both.
My current feeling is that normal productive activity, together with follow-up indexing and related processing, is creating much more pressure on Elasticsearch than expected.
You have a WEB_CONCURRENCYof 4 with 60 concurrent users. That can work, but I’d guess that the CPU spikes are not AI related and just happen to be in a similar time spot to be honest.
The railsserver does a lot of caching and stuff - I’m not suprised with the numbers you call to be honest. Even if you only have 200-300 tickets per day (which is already a number, but nothing Zammad can’t handle). Your agents moving through those tickets does move some dust - that’s totally normal and fine.
The rails server has low connection points to Elasticsearch. It’s relevant if an agent searches (as an example), but indexing is done via background jobs and thus area of your scheduler / worker.
The load and pressure of your system and especially Elasticsearch highly depends on the payloads. If you permanently update dozens of extremely long tickets with lots of data, the payload size towards to Elasticsearch can get troublesome or cause delay.
Some of these things should show in your Monitoring endpoint (in Zammad) if you have stacking delayed jobs. This generally sounds more like a performance tuning situation. Ensure that your system is installed as per recommendation of the documentation. This especially means the optional but recommended changes to Elasticsearch and your PostgreSQL-Server.
A load of 7 is nothing to worry about with a 10 core system. Your Elasticsearch seems to take 39GB of memory (if I read your screenshots correctly), which I assume is roughly 50% of the available memory. You might wanna limit the memory usage to something between 2 and 10GB. This will be more than enough. The key word you’re looking for is “heap size”.
1 Like
Thanks for the input.
I’ll keep an eye on the delayed jobs tomorrow during the hotspot period and check whether anything starts to stack up there.
As far as I know, Elasticsearch and PostgreSQL are already sized appropriately for the current load, but I’ll verify that again while monitoring the system.
Thanks again for your help.
Trust me, a maximum of 10GB memory usage is more than enough. I was responsible for Zammad SaaS for several years.
Yesterday, I rebuilt the nginx configuration based on the nginx and Zammad documentation. There were a lot of leftovers from older versions and configurations that are no longer considered best practice. The configuration is now clean and up to date.
Today, I enabled AI again for testing, and the web worker now seems to be running much more quietly, with CPU usage peaking at only 1–2%. Apparently, your suggestion about the web server was absolutely spot on — thanks for that. I will continue to monitor the situation.
1 Like
i forgot to say that yesterday, i also did the update that was linked in here - probably that fixed the issue.