ok, thank you, I’ll try that.
We also gonna setup a whole new vm and check if it’s maybe an configuration-problem in the vm.
Hi @anon28691334 - two questions:
- Are you on latest stable?
- Are you using the CTI integration?
If your answer is no and yes it might be this issue: https://github.com/zammad/zammad/issues/2193
Other from that we made pretty good experience for these kind of issues with rbspy. I’ll document the process here in the hope that it will help someone some day (hopefully you @anon28691334  ):
):
- Install the latest release of
rbspyfor your OS - Get the PID of your running puma process
- Start recording of your process for ~15 seconds (while the process is at 100% CPU)
- Stop recording via
CTRL+C - Note that
rbspywill create two files and print the paths for recordings - Post your recordings here in the community board where we can figure things out before creating an issue
I’m curious what your recordings look like.
JFI: rbspy is production safe! It only reads information from the running ruby process. Feel free to dig deeper into the documentation of this wonderful tool and show some love to Julia.
Greetings from France 


as an aside, maybe someone who likes a bit of edutainment will want to check out the following.
rbspy rings a bell, there was an interesting podcast I listened to a few months ago with Julia, made me almost want to turn evil and learn Ruby. https://twit.tv/shows/floss-weekly/episodes/487
1 Like
Learning ruby was the best decision ever! Nothing bad or evil about it What a beautiful language  Thanks for sharing. I’ll definitely check it out.
1 Like
We are on the latest version, available via apt. we enabled the cit-integration just for testing porposes, but deactivated it 2 days later. So at the moment, CTI is not enabled anymore.
Here are the formatted recordings:
Do you see anything?
<?xml version="1.0" standalone="no"?>
<!DOCTYPE svg PUBLIC "-//W3C//DTD SVG 1.1//EN" "http://www.w3.org/Graphics/SVG/1.1/DTD/svg11.dtd">
<svg version="1.1" width="1200" height="598" onload="init(evt)" viewBox="0 0 1200 598" xmlns="http://www.w3.org/2000/svg" xmlns:xlink="http://www.w3.org/1999/xlink">
<!-- Flame graph stack visualization. See https://github.com/brendangregg/FlameGraph for latest version, and http://www.brendangregg.com/flamegraphs.html for examples. -->
<!-- NOTES: -->
<defs >
<linearGradient id="background" y1="0" y2="1" x1="0" x2="0" >
<stop stop-color="#eeeeee" offset="5%" />
<stop stop-color="#eeeeb0" offset="95%" />
</linearGradient>
</defs>
<style type="text/css">
.func_g:hover { stroke:black; stroke-width:0.5; cursor:pointer; }
</style>
<script type="text/ecmascript">
<![CDATA[
var details, searchbtn, matchedtxt, svg;
function init(evt) {
details = document.getElementById("details").firstChild;
searchbtn = document.getElementById("search");
matchedtxt = document.getElementById("matched");
svg = document.getElementsByTagName("svg")[0];
searching = 0;
}
// mouse-over for info
function s(node) { // show
info = g_to_text(node);
details.nodeValue = "Function: " + info;
}
function c() { // clear
details.nodeValue = ' ';
}
// ctrl-F for search
window.addEventListener("keydown",function (e) {
if (e.keyCode === 114 || (e.ctrlKey && e.keyCode === 70)) {
e.preventDefault();
search_prompt();
}
})
// functions
function find_child(parent, name, attr) {
var children = parent.childNodes;
for (var i=0; i<children.length;i++) {
if (children[i].tagName == name)
return (attr != undefined) ? children[i].attributes[attr].value : children[i];
}
return;
}
function orig_save(e, attr, val) {
if (e.attributes["_orig_"+attr] != undefined) return;
if (e.attributes[attr] == undefined) return;
if (val == undefined) val = e.attributes[attr].value;
e.setAttribute("_orig_"+attr, val);
}
function orig_load(e, attr) {
if (e.attributes["_orig_"+attr] == undefined) return;
e.attributes[attr].value = e.attributes["_orig_"+attr].value;
e.removeAttribute("_orig_"+attr);
}
function g_to_text(e) {
var text = find_child(e, "title").firstChild.nodeValue;
return (text)
}
function g_to_func(e) {
var func = g_to_text(e);
// if there's any manipulation we want to do to the function
// name before it's searched, do it here before returning.
return (func);
}
function update_text(e) {
var r = find_child(e, "rect");
var t = find_child(e, "text");
var w = parseFloat(r.attributes["width"].value) -3;
var txt = find_child(e, "title").textContent.replace(/\([^(]*\)$/,"");
t.attributes["x"].value = parseFloat(r.attributes["x"].value) +3;
// Smaller than this size won't fit anything
if (w < 2*12*0.59) {
t.textContent = "";
return;
}
t.textContent = txt;
// Fit in full text width
if (/^ *$/.test(txt) || t.getSubStringLength(0, txt.length) < w)
return;
for (var x=txt.length-2; x>0; x--) {
if (t.getSubStringLength(0, x+2) <= w) {
t.textContent = txt.substring(0,x) + "..";
return;
}
}
t.textContent = "";
}
// zoom
function zoom_reset(e) {
if (e.attributes != undefined) {
orig_load(e, "x");
orig_load(e, "width");
}
if (e.childNodes == undefined) return;
for(var i=0, c=e.childNodes; i<c.length; i++) {
zoom_reset(c[i]);
}
}
function zoom_child(e, x, ratio) {
if (e.attributes != undefined) {
if (e.attributes["x"] != undefined) {
orig_save(e, "x");
e.attributes["x"].value = (parseFloat(e.attributes["x"].value) - x - 10) * ratio + 10;
if(e.tagName == "text") e.attributes["x"].value = find_child(e.parentNode, "rect", "x") + 3;
}
if (e.attributes["width"] != undefined) {
orig_save(e, "width");
e.attributes["width"].value = parseFloat(e.attributes["width"].value) * ratio;
}
}
if (e.childNodes == undefined) return;
for(var i=0, c=e.childNodes; i<c.length; i++) {
zoom_child(c[i], x-10, ratio);
}
}
function zoom_parent(e) {
if (e.attributes) {
if (e.attributes["x"] != undefined) {
orig_save(e, "x");
e.attributes["x"].value = 10;
}
if (e.attributes["width"] != undefined) {
orig_save(e, "width");
e.attributes["width"].value = parseInt(svg.width.baseVal.value) - (10*2);
}
}
if (e.childNodes == undefined) return;
for(var i=0, c=e.childNodes; i<c.length; i++) {
zoom_parent(c[i]);
}
}
function zoom(node) {
var attr = find_child(node, "rect").attributes;
var width = parseFloat(attr["width"].value);
var xmin = parseFloat(attr["x"].value);
var xmax = parseFloat(xmin + width);
var ymin = parseFloat(attr["y"].value);
var ratio = (svg.width.baseVal.value - 2*10) / width;
// XXX: Workaround for JavaScript float issues (fix me)
var fudge = 0.0001;
var unzoombtn = document.getElementById("unzoom");
unzoombtn.style["opacity"] = "1.0";
var el = document.getElementsByTagName("g");
for(var i=0;i<el.length;i++){
var e = el[i];
var a = find_child(e, "rect").attributes;
var ex = parseFloat(a["x"].value);
var ew = parseFloat(a["width"].value);
// Is it an ancestor
if (1 == 0) {
var upstack = parseFloat(a["y"].value) > ymin;
} else {
var upstack = parseFloat(a["y"].value) < ymin;
}
if (upstack) {
// Direct ancestor
if (ex <= xmin && (ex+ew+fudge) >= xmax) {
e.style["opacity"] = "0.5";
zoom_parent(e);
e.onclick = function(e){unzoom(); zoom(this);};
update_text(e);
}
// not in current path
else
e.style["display"] = "none";
}
// Children maybe
else {
// no common path
if (ex < xmin || ex + fudge >= xmax) {
e.style["display"] = "none";
}
else {
zoom_child(e, xmin, ratio);
e.onclick = function(e){zoom(this);};
update_text(e);
}
}
}
}
function unzoom() {
var unzoombtn = document.getElementById("unzoom");
unzoombtn.style["opacity"] = "0.0";
var el = document.getElementsByTagName("g");
for(i=0;i<el.length;i++) {
el[i].style["display"] = "block";
el[i].style["opacity"] = "1";
zoom_reset(el[i]);
update_text(el[i]);
}
}
// search
function reset_search() {
var el = document.getElementsByTagName("rect");
for (var i=0; i < el.length; i++) {
orig_load(el[i], "fill")
}
}
function search_prompt() {
if (!searching) {
var term = prompt("Enter a search term (regexp " +
"allowed, eg: ^ext4_)", "");
if (term != null) {
search(term)
}
} else {
reset_search();
searching = 0;
searchbtn.style["opacity"] = "0.1";
searchbtn.firstChild.nodeValue = "Search"
matchedtxt.style["opacity"] = "0.0";
matchedtxt.firstChild.nodeValue = ""
}
}
function search(term) {
var re = new RegExp(term);
var el = document.getElementsByTagName("g");
var matches = new Object();
var maxwidth = 0;
for (var i = 0; i < el.length; i++) {
var e = el[i];
if (e.attributes["class"].value != "func_g")
continue;
var func = g_to_func(e);
var rect = find_child(e, "rect");
if (rect == null) {
// the rect might be wrapped in an anchor
// if nameattr href is being used
if (rect = find_child(e, "a")) {
rect = find_child(r, "rect");
}
}
if (func == null || rect == null)
continue;
// Save max width. Only works as we have a root frame
var w = parseFloat(rect.attributes["width"].value);
if (w > maxwidth)
maxwidth = w;
if (func.match(re)) {
// highlight
var x = parseFloat(rect.attributes["x"].value);
orig_save(rect, "fill");
rect.attributes["fill"].value =
"rgb(230,0,230)";
// remember matches
if (matches[x] == undefined) {
matches[x] = w;
} else {
if (w > matches[x]) {
// overwrite with parent
matches[x] = w;
}
}
searching = 1;
}
}
if (!searching)
return;
searchbtn.style["opacity"] = "1.0";
searchbtn.firstChild.nodeValue = "Reset Search"
// calculate percent matched, excluding vertical overlap
var count = 0;
var lastx = -1;
var lastw = 0;
var keys = Array();
for (k in matches) {
if (matches.hasOwnProperty(k))
keys.push(k);
}
// sort the matched frames by their x location
// ascending, then width descending
keys.sort(function(a, b){
return a - b;
});
// Step through frames saving only the biggest bottom-up frames
// thanks to the sort order. This relies on the tree property
// where children are always smaller than their parents.
var fudge = 0.0001; // JavaScript floating point
for (var k in keys) {
var x = parseFloat(keys[k]);
var w = matches[keys[k]];
if (x >= lastx + lastw - fudge) {
count += w;
lastx = x;
lastw = w;
}
}
// display matched percent
matchedtxt.style["opacity"] = "1.0";
pct = 100 * count / maxwidth;
if (pct == 100)
pct = "100"
else
pct = pct.toFixed(1)
matchedtxt.firstChild.nodeValue = "Matched: " + pct + "%";
}
function searchover(e) {
searchbtn.style["opacity"] = "1.0";
}
function searchout(e) {
if (searching) {
searchbtn.style["opacity"] = "1.0";
} else {
searchbtn.style["opacity"] = "0.1";
}
}
]]>
</script>
<rect x="0.0" y="0" width="1200.0" height="598.0" fill="url(#background)" />
<text text-anchor="middle" x="600.00" y="24" font-size="17" font-family="Verdana" fill="rgb(0,0,0)" >Icicle Graph</text>
<text text-anchor="" x="10.00" y="581" font-size="12" font-family="Verdana" fill="rgb(0,0,0)" id="details" > </text>
<text text-anchor="" x="10.00" y="24" font-size="12" font-family="Verdana" fill="rgb(0,0,0)" id="unzoom" onclick="unzoom()" style="opacity:0.0;cursor:pointer" >Reset Zoom</text>
<text text-anchor="" x="1090.00" y="24" font-size="12" font-family="Verdana" fill="rgb(0,0,0)" id="search" onmouseover="searchover()" onmouseout="searchout()" onclick="search_prompt()" style="opacity:0.1;cursor:pointer" >Search</text>
<text text-anchor="" x="1090.00" y="581" font-size="12" font-family="Verdana" fill="rgb(0,0,0)" id="matched" > </text>
<g class="func_g" onmouseover="s(this)" onmouseout="c()" onclick="zoom(this)">
<title>block in <top (required)> - /opt/zammad/vendor/bundle/ruby/2.4.0/gems/bundler-1.15.2/exe/bundle line 30 (169 samples, 100.00%)</title><rect x="10.0" y="116" width="1180.0" height="15.0" fill="rgb(224,60,24)" rx="2" ry="2" />
<text text-anchor="" x="13.00" y="126.5" font-size="12" font-family="Verdana" fill="rgb(0,0,0)" >block in <top (required)> - /opt/zammad/vendor/bundle/ruby/2.4.0/gems/bundler-1.15.2/exe/bundle line 30</text>
</g>
<g class="func_g" onmouseover="s(this)" onmouseout="c()" onclick="zoom(this)">
<title>dispatch - /opt/zammad/vendor/bundle/ruby/2.4.0/gems/thor-0.20.0/lib/thor.rb line 387 (169 samples, 100.00%)</title><rect x="10.0" y="372" width="1180.0" height="15.0" fill="rgb(245,207,45)" rx="2" ry="2" />
<text text-anchor="" x="13.00" y="382.5" font-size="12" font-family="Verdana" fill="rgb(0,0,0)" >dispatch - /opt/zammad/vendor/bundle/ruby/2.4.0/gems/thor-0.20.0/lib/thor.rb line 387</text>
</g>
<g class="func_g" onmouseover="s(this)" onmouseout="c()" onclick="zoom(this)">
<title>start - /opt/zammad/vendor/bundle/ruby/2.4.0/gems/railties-5.1.5/lib/rails/commands/server/server_command.rb line 44 (169 samples, 100.00%)</title><rect x="10.0" y="468" width="1180.0" height="15.0" fill="rgb(213,16,4)" rx="2" ry="2" />
<text text-anchor="" x="13.00" y="478.5" font-size="12" font-family="Verdana" fill="rgb(0,0,0)" >start - /opt/zammad/vendor/bundle/ruby/2.4.0/gems/railties-5.1.5/lib/rails/commands/server/server_command.rb line 44</text>
</g>
<g class="func_g" onmouseover="s(this)" onmouseout="c()" onclick="zoom(this)">
<title><c function> - unknown line 0 (169 samples, 100.00%)</title><rect x="10.0" y="276" width="1180.0" height="15.0" fill="rgb(225,66,44)" rx="2" ry="2" />
<text text-anchor="" x="13.00" y="286.5" font-size="12" font-family="Verdana" fill="rgb(0,0,0)" ><c function> - unknown line 0</text>
</g>
<g class="func_g" onmouseover="s(this)" onmouseout="c()" onclick="zoom(this)">
<title><top (required)> - /opt/zammad/vendor/bundle/ruby/2.4.0/gems/railties-5.1.5/lib/rails/commands.rb line 16 (169 samples, 100.00%)</title><rect x="10.0" y="324" width="1180.0" height="15.0" fill="rgb(223,218,8)" rx="2" ry="2" />
<text text-anchor="" x="13.00" y="334.5" font-size="12" font-family="Verdana" fill="rgb(0,0,0)" ><top (required)> - /opt/zammad/vendor/bundle/ruby/2.4.0/gems/railties-5.1.5/lib/rails/commands.rb line 16</text>
</g>
<g class="func_g" onmouseover="s(this)" onmouseout="c()" onclick="zoom(this)">
<title>start - /opt/zammad/vendor/bundle/ruby/2.4.0/gems/rack-2.0.5/lib/rack/server.rb line 297 (169 samples, 100.00%)</title><rect x="10.0" y="484" width="1180.0" height="15.0" fill="rgb(209,142,10)" rx="2" ry="2" />
<text text-anchor="" x="13.00" y="494.5" font-size="12" font-family="Verdana" fill="rgb(0,0,0)" >start - /opt/zammad/vendor/bundle/ruby/2.4.0/gems/rack-2.0.5/lib/rack/server.rb line 297</text>
</g>
<g class="func_g" onmouseover="s(this)" onmouseout="c()" onclick="zoom(this)">
<title><main> - /opt/zammad/bin/bundle line 3 (169 samples, 100.00%)</title><rect x="10.0" y="52" width="1180.0" height="15.0" fill="rgb(249,63,23)" rx="2" ry="2" />
<text text-anchor="" x="13.00" y="62.5" font-size="12" font-family="Verdana" fill="rgb(0,0,0)" ><main> - /opt/zammad/bin/bundle line 3</text>
</g>
<g class="func_g" onmouseover="s(this)" onmouseout="c()" onclick="zoom(this)">
<title>kernel_load - /opt/zammad/vendor/bundle/ruby/2.4.0/gems/bundler-1.15.2/lib/bundler/cli/exec.rb line 74 (169 samples, 100.00%)</title><rect x="10.0" y="260" width="1180.0" height="15.0" fill="rgb(219,4,44)" rx="2" ry="2" />
<text text-anchor="" x="13.00" y="270.5" font-size="12" font-family="Verdana" fill="rgb(0,0,0)" >kernel_load - /opt/zammad/vendor/bundle/ruby/2.4.0/gems/bundler-1.15.2/lib/bundler/cli/exec.rb line 74</text>
</g>
<g class="func_g" onmouseover="s(this)" onmouseout="c()" onclick="zoom(this)">
<title><top (required)> - /opt/zammad/vendor/bundle/ruby/2.4.0/gems/bundler-1.15.2/exe/bundle line 22 (169 samples, 100.00%)</title><rect x="10.0" y="84" width="1180.0" height="15.0" fill="rgb(205,15,38)" rx="2" ry="2" />
<text text-anchor="" x="13.00" y="94.5" font-size="12" font-family="Verdana" fill="rgb(0,0,0)" ><top (required)> - /opt/zammad/vendor/bundle/ruby/2.4.0/gems/bundler-1.15.2/exe/bundle line 22</text>
</g>
<g class="func_g" onmouseover="s(this)" onmouseout="c()" onclick="zoom(this)">
<title>perform - /opt/zammad/vendor/bundle/ruby/2.4.0/gems/railties-5.1.5/lib/rails/command/base.rb line 63 (169 samples, 100.00%)</title><rect x="10.0" y="356" width="1180.0" height="15.0" fill="rgb(214,171,53)" rx="2" ry="2" />
<text text-anchor="" x="13.00" y="366.5" font-size="12" font-family="Verdana" fill="rgb(0,0,0)" >perform - /opt/zammad/vendor/bundle/ruby/2.4.0/gems/railties-5.1.5/lib/rails/command/base.rb line 63</text>
</g>
<g class="func_g" onmouseover="s(this)" onmouseout="c()" onclick="zoom(this)">
<title><c function> - unknown line 0 (169 samples, 100.00%)</title><rect x="10.0" y="436" width="1180.0" height="15.0" fill="rgb(230,145,20)" rx="2" ry="2" />
<text text-anchor="" x="13.00" y="446.5" font-size="12" font-family="Verdana" fill="rgb(0,0,0)" ><c function> - unknown line 0</text>
</g>
<g class="func_g" onmouseover="s(this)" onmouseout="c()" onclick="zoom(this)">
<title>run - /opt/zammad/vendor/bundle/ruby/2.4.0/gems/puma-3.11.0/lib/puma/cluster.rb line 507 (169 samples, 100.00%)</title><rect x="10.0" y="532" width="1180.0" height="15.0" fill="rgb(250,189,9)" rx="2" ry="2" />
<text text-anchor="" x="13.00" y="542.5" font-size="12" font-family="Verdana" fill="rgb(0,0,0)" >run - /opt/zammad/vendor/bundle/ruby/2.4.0/gems/puma-3.11.0/lib/puma/cluster.rb line 507</text>
</g>
<g class="func_g" onmouseover="s(this)" onmouseout="c()" onclick="zoom(this)">
<title>block in perform - /opt/zammad/vendor/bundle/ruby/2.4.0/gems/railties-5.1.5/lib/rails/commands/server/server_command.rb line 135 (169 samples, 100.00%)</title><rect x="10.0" y="452" width="1180.0" height="15.0" fill="rgb(237,174,48)" rx="2" ry="2" />
<text text-anchor="" x="13.00" y="462.5" font-size="12" font-family="Verdana" fill="rgb(0,0,0)" >block in perform - /opt/zammad/vendor/bundle/ruby/2.4.0/gems/railties-5.1.5/lib/rails/commands/server/server_command.rb line 135</text>
</g>
<g class="func_g" onmouseover="s(this)" onmouseout="c()" onclick="zoom(this)">
<title>invoke - /opt/zammad/vendor/bundle/ruby/2.4.0/gems/railties-5.1.5/lib/rails/command.rb line 46 (169 samples, 100.00%)</title><rect x="10.0" y="340" width="1180.0" height="15.0" fill="rgb(218,59,53)" rx="2" ry="2" />
<text text-anchor="" x="13.00" y="350.5" font-size="12" font-family="Verdana" fill="rgb(0,0,0)" >invoke - /opt/zammad/vendor/bundle/ruby/2.4.0/gems/railties-5.1.5/lib/rails/command.rb line 46</text>
</g>
<g class="func_g" onmouseover="s(this)" onmouseout="c()" onclick="zoom(this)">
<title>dispatch - /opt/zammad/vendor/bundle/ruby/2.4.0/gems/bundler-1.15.2/lib/bundler/vendor/thor/lib/thor.rb line 369 (169 samples, 100.00%)</title><rect x="10.0" y="180" width="1180.0" height="15.0" fill="rgb(246,198,3)" rx="2" ry="2" />
<text text-anchor="" x="13.00" y="190.5" font-size="12" font-family="Verdana" fill="rgb(0,0,0)" >dispatch - /opt/zammad/vendor/bundle/ruby/2.4.0/gems/bundler-1.15.2/lib/bundler/vendor/thor/lib/thor.rb line 369</text>
</g>
<g class="func_g" onmouseover="s(this)" onmouseout="c()" onclick="zoom(this)">
<title><c function> - unknown line 0 (169 samples, 100.00%)</title><rect x="10.0" y="548" width="1180.0" height="15.0" fill="rgb(251,16,19)" rx="2" ry="2" />
<text text-anchor="" x="13.00" y="558.5" font-size="12" font-family="Verdana" fill="rgb(0,0,0)" ><c function> - unknown line 0</text>
</g>
<g class="func_g" onmouseover="s(this)" onmouseout="c()" onclick="zoom(this)">
<title>start - /opt/zammad/vendor/bundle/ruby/2.4.0/gems/bundler-1.15.2/lib/bundler/vendor/thor/lib/thor/base.rb line 444 (169 samples, 100.00%)</title><rect x="10.0" y="148" width="1180.0" height="15.0" fill="rgb(229,49,5)" rx="2" ry="2" />
<text text-anchor="" x="13.00" y="158.5" font-size="12" font-family="Verdana" fill="rgb(0,0,0)" >start - /opt/zammad/vendor/bundle/ruby/2.4.0/gems/bundler-1.15.2/lib/bundler/vendor/thor/lib/thor/base.rb line 444</text>
</g>
<g class="func_g" onmouseover="s(this)" onmouseout="c()" onclick="zoom(this)">
<title>with_friendly_errors - /opt/zammad/vendor/bundle/ruby/2.4.0/gems/bundler-1.15.2/lib/bundler/friendly_errors.rb line 121 (169 samples, 100.00%)</title><rect x="10.0" y="100" width="1180.0" height="15.0" fill="rgb(225,142,31)" rx="2" ry="2" />
<text text-anchor="" x="13.00" y="110.5" font-size="12" font-family="Verdana" fill="rgb(0,0,0)" >with_friendly_errors - /opt/zammad/vendor/bundle/ruby/2.4.0/gems/bundler-1.15.2/lib/bundler/friendly_errors.rb line 121</text>
</g>
<g class="func_g" onmouseover="s(this)" onmouseout="c()" onclick="zoom(this)">
<title>run - /opt/zammad/vendor/bundle/ruby/2.4.0/gems/thor-0.20.0/lib/thor/command.rb line 31 (169 samples, 100.00%)</title><rect x="10.0" y="404" width="1180.0" height="15.0" fill="rgb(246,10,7)" rx="2" ry="2" />
<text text-anchor="" x="13.00" y="414.5" font-size="12" font-family="Verdana" fill="rgb(0,0,0)" >run - /opt/zammad/vendor/bundle/ruby/2.4.0/gems/thor-0.20.0/lib/thor/command.rb line 31</text>
</g>
<g class="func_g" onmouseover="s(this)" onmouseout="c()" onclick="zoom(this)">
<title>invoke_command - /opt/zammad/vendor/bundle/ruby/2.4.0/gems/thor-0.20.0/lib/thor/invocation.rb line 126 (169 samples, 100.00%)</title><rect x="10.0" y="388" width="1180.0" height="15.0" fill="rgb(244,98,23)" rx="2" ry="2" />
<text text-anchor="" x="13.00" y="398.5" font-size="12" font-family="Verdana" fill="rgb(0,0,0)" >invoke_command - /opt/zammad/vendor/bundle/ruby/2.4.0/gems/thor-0.20.0/lib/thor/invocation.rb line 126</text>
</g>
<g class="func_g" onmouseover="s(this)" onmouseout="c()" onclick="zoom(this)">
<title>start - /opt/zammad/vendor/bundle/ruby/2.4.0/gems/bundler-1.15.2/lib/bundler/cli.rb line 10 (169 samples, 100.00%)</title><rect x="10.0" y="132" width="1180.0" height="15.0" fill="rgb(209,6,19)" rx="2" ry="2" />
<text text-anchor="" x="13.00" y="142.5" font-size="12" font-family="Verdana" fill="rgb(0,0,0)" >start - /opt/zammad/vendor/bundle/ruby/2.4.0/gems/bundler-1.15.2/lib/bundler/cli.rb line 10</text>
</g>
<g class="func_g" onmouseover="s(this)" onmouseout="c()" onclick="zoom(this)">
<title><c function> - unknown line 0 (169 samples, 100.00%)</title><rect x="10.0" y="68" width="1180.0" height="15.0" fill="rgb(206,223,48)" rx="2" ry="2" />
<text text-anchor="" x="13.00" y="78.5" font-size="12" font-family="Verdana" fill="rgb(0,0,0)" ><c function> - unknown line 0</text>
</g>
<g class="func_g" onmouseover="s(this)" onmouseout="c()" onclick="zoom(this)">
<title>invoke_command - /opt/zammad/vendor/bundle/ruby/2.4.0/gems/bundler-1.15.2/lib/bundler/vendor/thor/lib/thor/invocation.rb line 126 (169 samples, 100.00%)</title><rect x="10.0" y="196" width="1180.0" height="15.0" fill="rgb(217,93,35)" rx="2" ry="2" />
<text text-anchor="" x="13.00" y="206.5" font-size="12" font-family="Verdana" fill="rgb(0,0,0)" >invoke_command - /opt/zammad/vendor/bundle/ruby/2.4.0/gems/bundler-1.15.2/lib/bundler/vendor/thor/lib/thor/invocation.rb line 126</text>
</g>
<g class="func_g" onmouseover="s(this)" onmouseout="c()" onclick="zoom(this)">
<title>perform - /opt/zammad/vendor/bundle/ruby/2.4.0/gems/railties-5.1.5/lib/rails/commands/server/server_command.rb line 130 (169 samples, 100.00%)</title><rect x="10.0" y="420" width="1180.0" height="15.0" fill="rgb(248,130,54)" rx="2" ry="2" />
<text text-anchor="" x="13.00" y="430.5" font-size="12" font-family="Verdana" fill="rgb(0,0,0)" >perform - /opt/zammad/vendor/bundle/ruby/2.4.0/gems/railties-5.1.5/lib/rails/commands/server/server_command.rb line 130</text>
</g>
<g class="func_g" onmouseover="s(this)" onmouseout="c()" onclick="zoom(this)">
<title><c function> - unknown line 0 (169 samples, 100.00%)</title><rect x="10.0" y="308" width="1180.0" height="15.0" fill="rgb(217,228,48)" rx="2" ry="2" />
<text text-anchor="" x="13.00" y="318.5" font-size="12" font-family="Verdana" fill="rgb(0,0,0)" ><c function> - unknown line 0</text>
</g>
<g class="func_g" onmouseover="s(this)" onmouseout="c()" onclick="zoom(this)">
<title>run - /opt/zammad/vendor/bundle/ruby/2.4.0/gems/bundler-1.15.2/lib/bundler/vendor/thor/lib/thor/command.rb line 31 (169 samples, 100.00%)</title><rect x="10.0" y="212" width="1180.0" height="15.0" fill="rgb(236,148,22)" rx="2" ry="2" />
<text text-anchor="" x="13.00" y="222.5" font-size="12" font-family="Verdana" fill="rgb(0,0,0)" >run - /opt/zammad/vendor/bundle/ruby/2.4.0/gems/bundler-1.15.2/lib/bundler/vendor/thor/lib/thor/command.rb line 31</text>
</g>
<g class="func_g" onmouseover="s(this)" onmouseout="c()" onclick="zoom(this)">
<title>dispatch - /opt/zammad/vendor/bundle/ruby/2.4.0/gems/bundler-1.15.2/lib/bundler/cli.rb line 20 (169 samples, 100.00%)</title><rect x="10.0" y="164" width="1180.0" height="15.0" fill="rgb(228,92,52)" rx="2" ry="2" />
<text text-anchor="" x="13.00" y="174.5" font-size="12" font-family="Verdana" fill="rgb(0,0,0)" >dispatch - /opt/zammad/vendor/bundle/ruby/2.4.0/gems/bundler-1.15.2/lib/bundler/cli.rb line 20</text>
</g>
<g class="func_g" onmouseover="s(this)" onmouseout="c()" onclick="zoom(this)">
<title><top (required)> - /opt/zammad/script/rails line 6 (169 samples, 100.00%)</title><rect x="10.0" y="292" width="1180.0" height="15.0" fill="rgb(212,52,37)" rx="2" ry="2" />
<text text-anchor="" x="13.00" y="302.5" font-size="12" font-family="Verdana" fill="rgb(0,0,0)" ><top (required)> - /opt/zammad/script/rails line 6</text>
</g>
<g class="func_g" onmouseover="s(this)" onmouseout="c()" onclick="zoom(this)">
<title>run - /opt/zammad/vendor/bundle/ruby/2.4.0/gems/bundler-1.15.2/lib/bundler/cli/exec.rb line 37 (169 samples, 100.00%)</title><rect x="10.0" y="244" width="1180.0" height="15.0" fill="rgb(231,23,48)" rx="2" ry="2" />
<text text-anchor="" x="13.00" y="254.5" font-size="12" font-family="Verdana" fill="rgb(0,0,0)" >run - /opt/zammad/vendor/bundle/ruby/2.4.0/gems/bundler-1.15.2/lib/bundler/cli/exec.rb line 37</text>
</g>
<g class="func_g" onmouseover="s(this)" onmouseout="c()" onclick="zoom(this)">
<title>exec - /opt/zammad/vendor/bundle/ruby/2.4.0/gems/bundler-1.15.2/lib/bundler/cli.rb line 360 (169 samples, 100.00%)</title><rect x="10.0" y="228" width="1180.0" height="15.0" fill="rgb(221,6,52)" rx="2" ry="2" />
<text text-anchor="" x="13.00" y="238.5" font-size="12" font-family="Verdana" fill="rgb(0,0,0)" >exec - /opt/zammad/vendor/bundle/ruby/2.4.0/gems/bundler-1.15.2/lib/bundler/cli.rb line 360</text>
</g>
<g class="func_g" onmouseover="s(this)" onmouseout="c()" onclick="zoom(this)">
<title>run - /opt/zammad/vendor/bundle/ruby/2.4.0/gems/puma-3.11.0/lib/puma/launcher.rb line 194 (169 samples, 100.00%)</title><rect x="10.0" y="516" width="1180.0" height="15.0" fill="rgb(236,171,6)" rx="2" ry="2" />
<text text-anchor="" x="13.00" y="526.5" font-size="12" font-family="Verdana" fill="rgb(0,0,0)" >run - /opt/zammad/vendor/bundle/ruby/2.4.0/gems/puma-3.11.0/lib/puma/launcher.rb line 194</text>
</g>
<g class="func_g" onmouseover="s(this)" onmouseout="c()" onclick="zoom(this)">
<title>all (169 samples, 100%)</title><rect x="10.0" y="36" width="1180.0" height="15.0" fill="rgb(228,175,50)" rx="2" ry="2" />
<text text-anchor="" x="13.00" y="46.5" font-size="12" font-family="Verdana" fill="rgb(0,0,0)" ></text>
</g>
<g class="func_g" onmouseover="s(this)" onmouseout="c()" onclick="zoom(this)">
<title>run - /opt/zammad/vendor/bundle/ruby/2.4.0/gems/puma-3.11.0/lib/rack/handler/puma.rb line 69 (169 samples, 100.00%)</title><rect x="10.0" y="500" width="1180.0" height="15.0" fill="rgb(211,198,31)" rx="2" ry="2" />
<text text-anchor="" x="13.00" y="510.5" font-size="12" font-family="Verdana" fill="rgb(0,0,0)" >run - /opt/zammad/vendor/bundle/ruby/2.4.0/gems/puma-3.11.0/lib/rack/handler/puma.rb line 69</text>
</g>
</svg>OK, we’ve narrowed it down. It always occurs when a new session is created (e.g. when someone logs on.). Then puma consumes about 50 - 70% of the CPU power of all cores for about 5 minutes and blocks zammad completely. During this time, no new actions are possible in the UI and the users sometimes get an Error 500.
Hi @anon28691334 - thanks for the heads up. The file you send me is an SVG file which can be opened via e.g. a browser and looks like this:
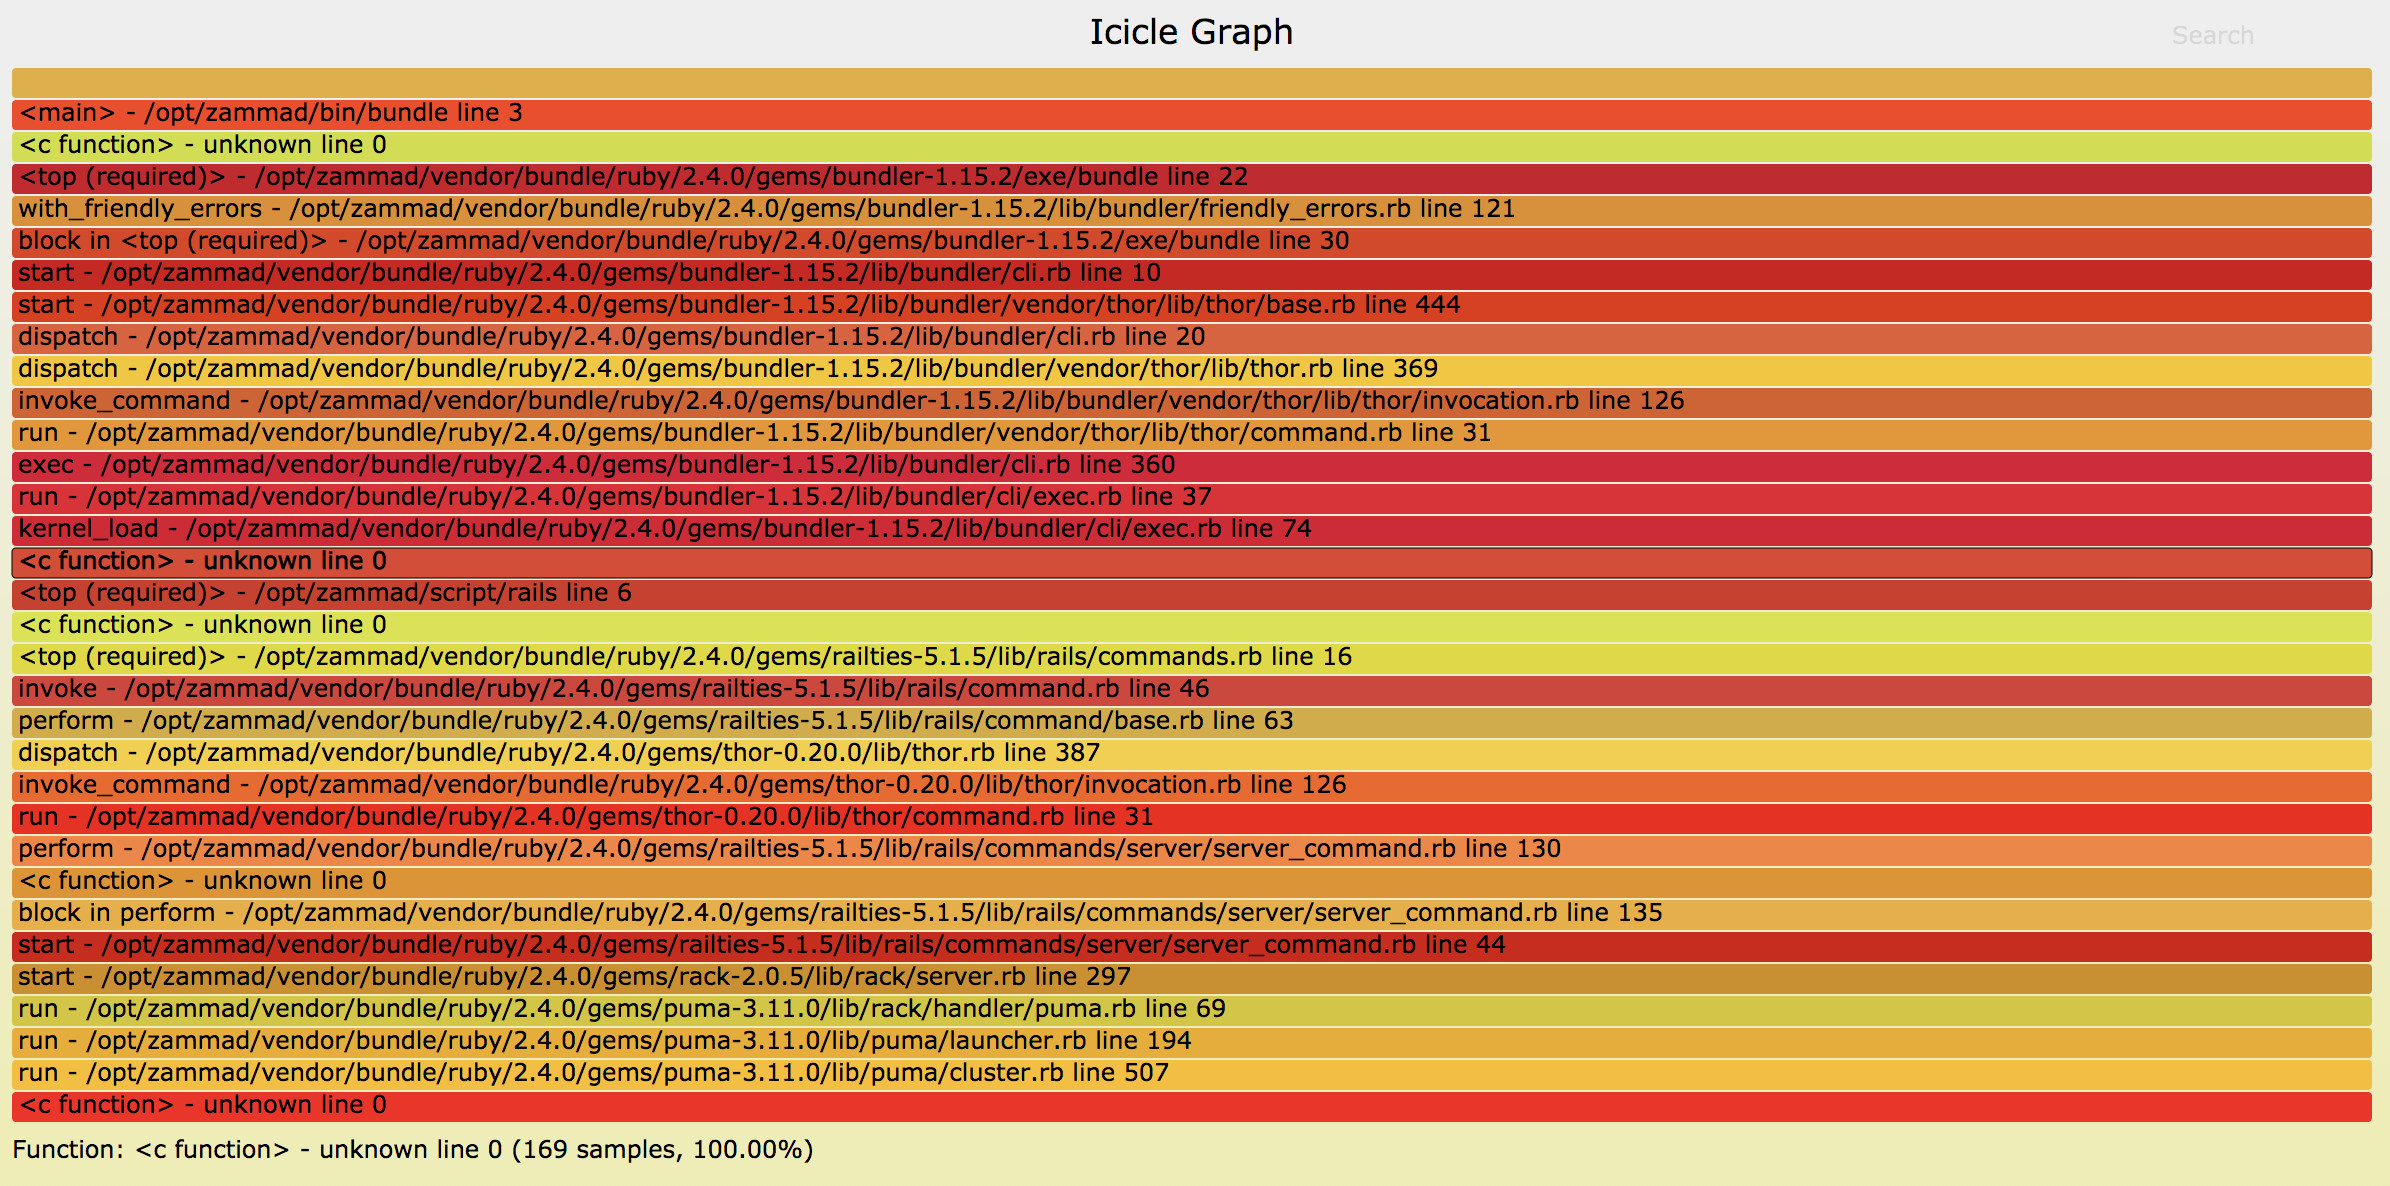
This may look rather cryptical. It reads like a timeline where the left side is the start and the right side is the end. The most top line is the whole process and every line below is a sub method call, sub-sub method call and so on. Usually this looks more clustered. In your case you can see that the whole time is spend in <c function> - unknown line 0. Therefore the line above is interesting: It’s in the cluster.rb file of puma (the Ruby web-/application server). Looking at the source code revealed that this line starts/executes sub processes.
TL;DR: It looks like you got the wrong process ![]()
ok, I must have done the trace with the cluster PID.
Since I can’t upload SVG files here, I uploaded the files of the 8 puma processes in our Google Drive. I hope that’s okay: https://drive.google.com/drive/folders/1OLdKXG9_fV5XtFm91nxJa3ozh_RjB2iT?usp=sharing
These files are perfect. Here is a screenshot of the relevant part of one of those files which makes the situation clear:
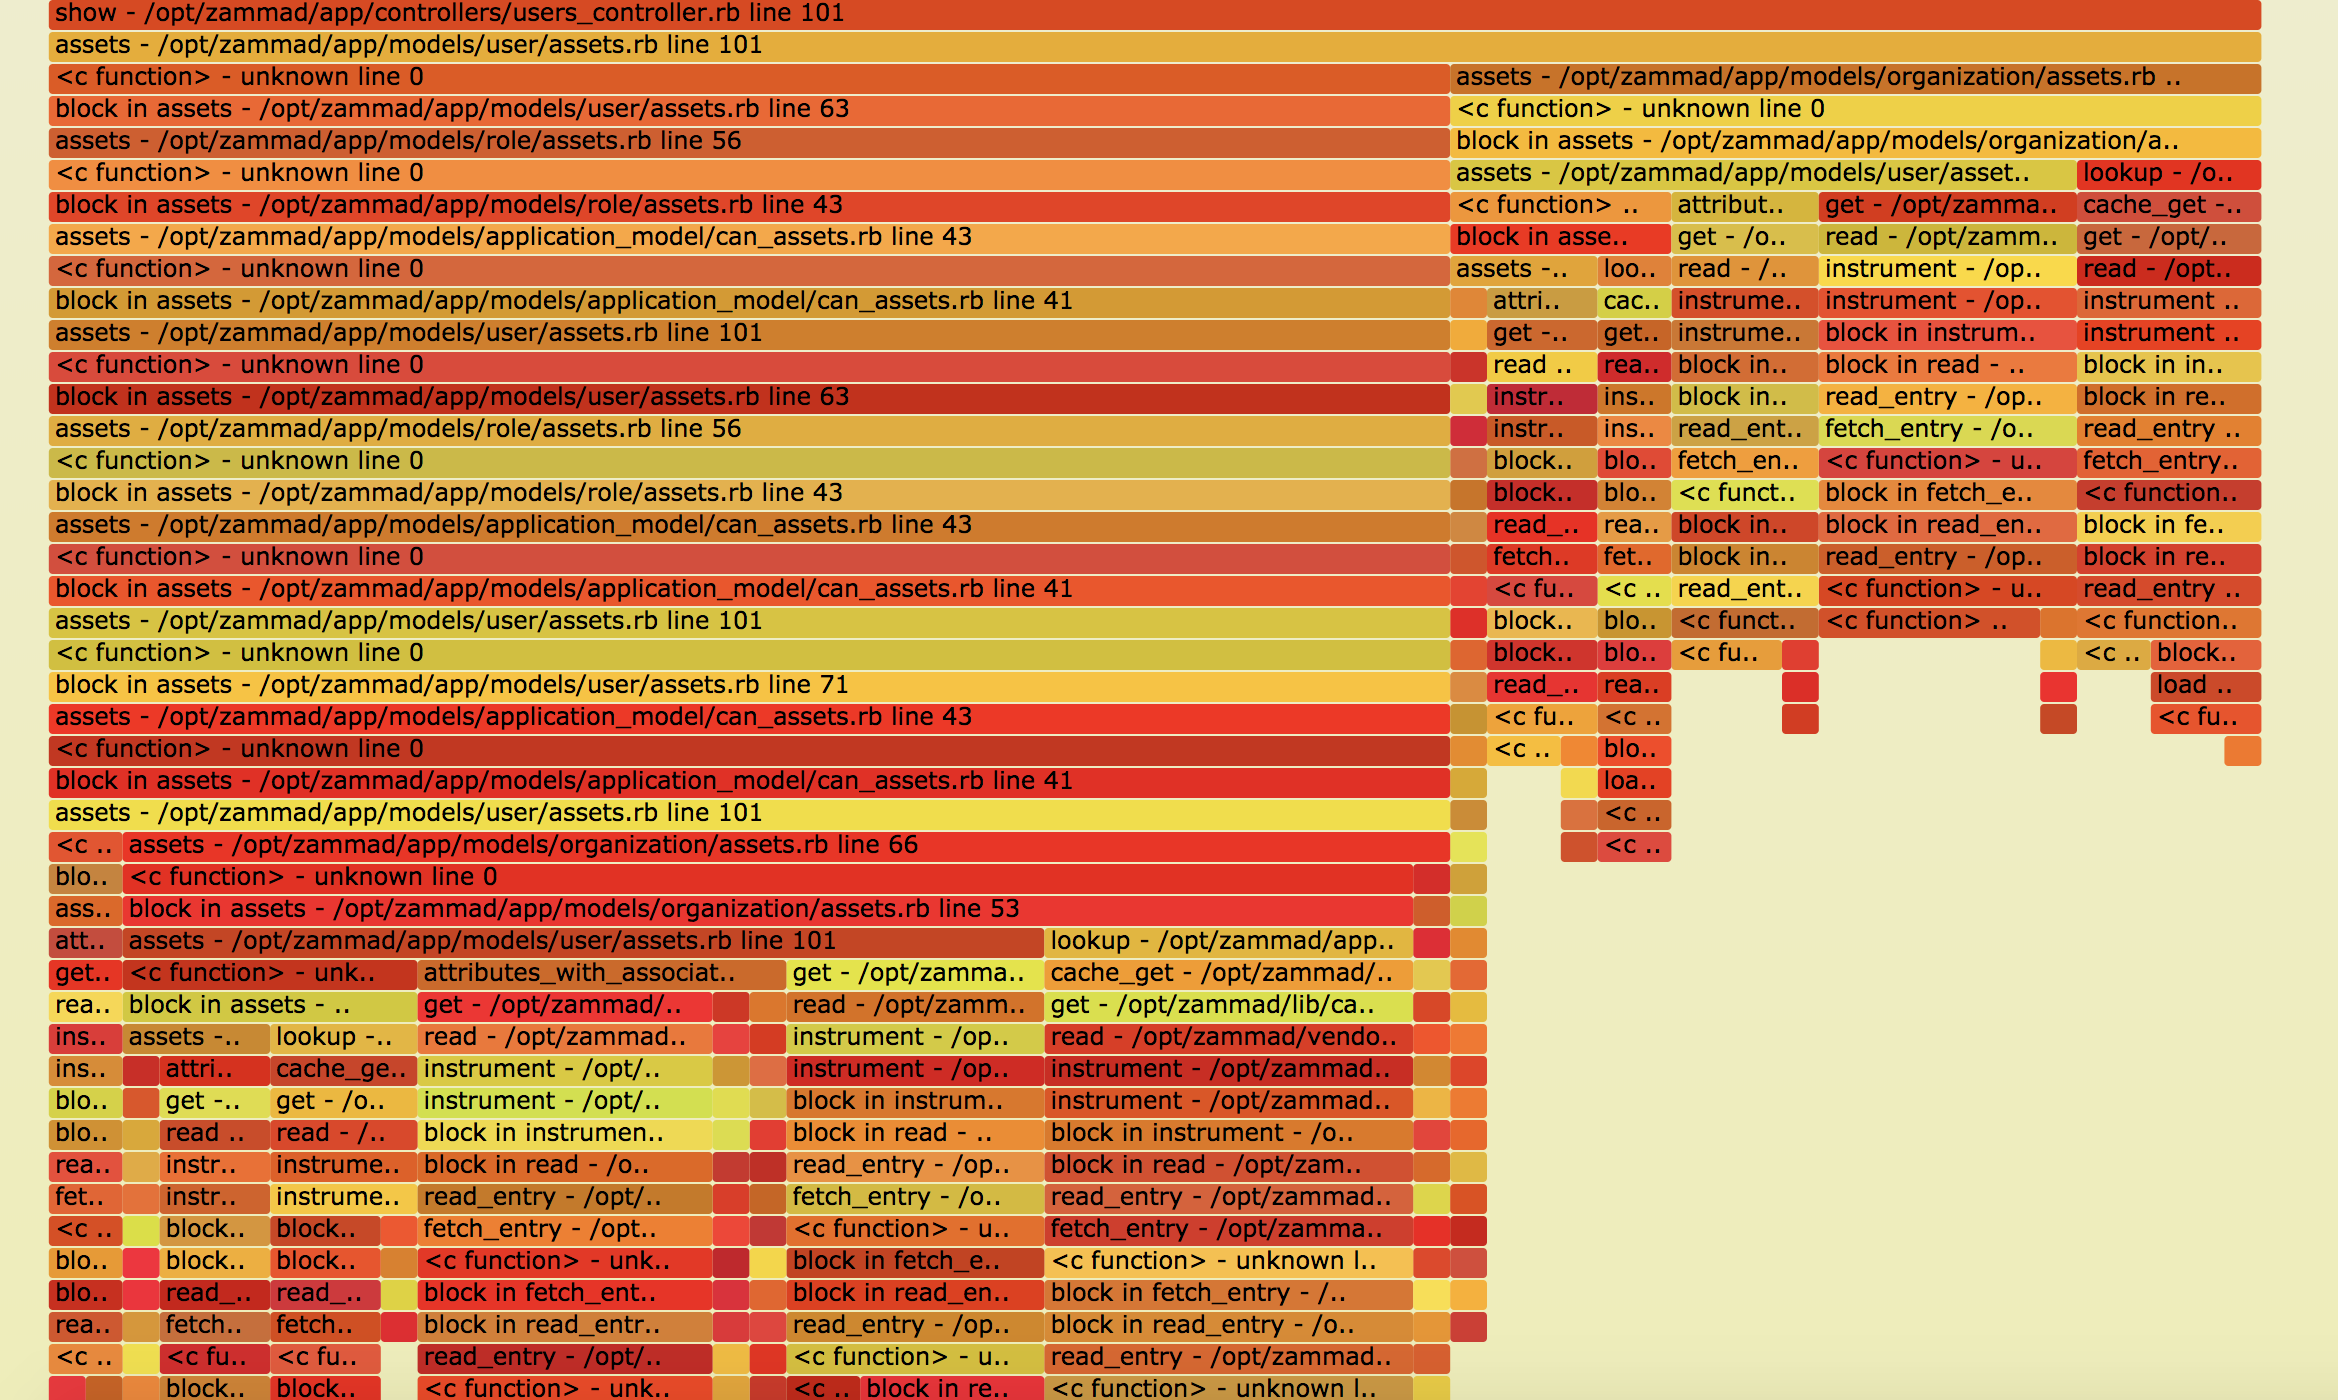
So we read it from top down: The request starts at the show method of the file app/controllers/users_controller.rb. Which is a request to fetch all data for one certain user. Log entries for these requests usually look something like this:
I, [2018-08-31T18:39:10.505544 #95878]  INFO -- : Processing by UsersController#show as JSON
I, [2018-08-31T18:39:10.508053 #95878]  INFO -- :   Parameters: {"full"=>"true", "_"=>"1535730254901", "id"=>"2"}
The id parameter indicates for which user the information gets fetched. In this example it’s the user with the ID 2.
For your situation it would be interesting which User ID(s) cause(s) the CPU load. Please have a look at in your production.log file and check the most recent UsersController#show entries with their User ID parameters. You can manually execute such a request by opening a browser window with the URL https://your.zammad.tld/api/v1/users/*user_id* (e.g. https://your.zammad.tld/api/v1/users/2). It would be good to know how long such a call takes and if you can see a CPU load peak for a new process.
After that I’ll be able pro provide a debugging script and see where the time is spend and what the expensive operations are.
I assume that there is a Organization with a lot of users assigned. To verify this please run the following code in your Zammad Rails console and post the anonymized output here:
User.where.not(organization_id: nil).group(:organization_id).count.each_with_object({}) { |(o_id, count), result| result[ "#{Organization.find(o_id).name} ID: #{o_id}" ] = count }
The output should look like this:
{"Zammad Foundation ID: 1"=>1,
 "Name der Firma1 ID: 2"=>10,
 "Name der Firma2 ID: 3"=>27,
 "Name der Firma4 ID: 4"=>6,
 "Name der Firma5 ID: 5"=>14,
 "Name der Firma6 ID: 6"=>11,
 "Name der Firma9 ID: 7"=>8,
 "Name der Firma14 ID: 8"=>16,
 "Name der Firma16 ID: 9"=>23,
 "Name der Firma17 ID: 10"=>5,
 "Name der Firma18 ID: 11"=>3}
thank you for your help.
the only users who log on to our system are our users. As already suspected, they are all bundled in one organization:
{
"Zammad Foundation ID: 1"=>1,
"Name der Firma1 ID: 2"=>95,
"Name der Firma2 ID: 4"=>1,
"Name der Firma3 ID: 5"=>1,
"Name der Firma4 ID: 6"=>2,
"Name der Firma5 ID: 7"=>1
}
The API call takes 33 seconds the first time I log in and 1.5 seconds the second time. In both cases, however, a new process is triggered which raises the peak.
It was definitely the organization that triggered the problem. After removing all users from all organizations, the CPU usage of all cores is about 0.5%. But this can be a dirty workaround at most because we need the organizations and it is predictable that we will have customers with 30 and more users.
I can’t help with the bug, but maybe try updating to the latest release, create a new organisation and user and see if that user triggers the issue?
Hi guys. I still don’t get how the notification system works  I haven’t received any email notification for your replies. Anyhow, thanks @anon28691334 for the deeper investigation. Fetching (uncached) assets of a big Organization may take some time. However, on my local machine it takes only 2 seconds to fetch an Organization with 100 Users with a totally blank cache. With a pre-heated cache it only takes 0.02 seconds.
You’re saying that the second time you perform the login it’s done much faster. Does this mean that the CPU peak for this process is that short as well?
I’ve build a little debugging script that should give more insights on where the time is spend and if it’s only a certain User that makes this request so slow.
To use this script please do the following:
- Add the following line to your
Gemfilefile in your Zammad directory:
gem 'ruby-prof' - Run
bundle install(orzammad run bundle install- depending on your setup) - Create a file called
profiling-issue.rbin your Zammad directory. - Place the code from below in the file.
- Run the file with your Organization as a parameter via
rails r profiling-issue.rb *ORGANIZATION_ID*(orzammad run rails r profiling-issue.rb *ORGANIZATION_ID*- depending on your setup) - Provide the following files here that were created in your Zammad directory (please note that instead of the * there will be a number):
profiling.empty-cache.*.htmlprofiling.pre-heated-cache.*.htmlprofiling.no-asset-reusage.*.htmlno-asset-reusage.txt
There is no confidential data logged/included in these files.
- Remove the added line from your
Gemfile - Run
bundle install(orzammad run bundle install- depending on your setup)
The script:
organization_id = ARGV[0]
abort "Missing Organization ID parameter." if organization_id.blank?

puts "Define helper method that profiles the given block..."
def profile_as(profile)
  RubyProf.measure_mode = RubyProf::WALL_TIME

  RubyProf.start

  profle_time_start = Time.now.to_f
  yield
  profle_time_total = Time.now.to_f - profle_time_start

  results = RubyProf.stop

  File.open("profiling.#{profile}.#{profle_time_total}.html", 'w') do |out|
    # RubyProf::FlameGraphPrinter.new(results).print(out)
    RubyProf::CallStackPrinter.new(results).print(out)
  end
end

puts "Finding Organization with ID #{organization_id} ..."
organization = Organization.find(organization_id)

puts "Switch over to (clean) in-memory cache..."
Rails.cache = ActiveSupport::Cache.lookup_store(:memory_store, { size: 200.megabytes })

puts "Start actual profiling for 'empty-cache'..."
profile_as('empty-cache') do
  organization.assets({})
end

puts "Start actual profiling for 'pre-heated-cache'..."
profile_as('pre-heated-cache') do
  organization.assets({})
end

puts "Start actual profiling for 'no-asset-reusage'..."
run_time_start = Time.now.to_f
time_map       = {}
profile_as('no-asset-reusage') do

  time_map = organization.member_ids.each_with_object({}) do |user_id, result|

    user = User.lookup(id: user_id)
    next if !user

    asset_time_start = Time.now.to_f
    user.assets({})
    result[user_id] = Time.now.to_f - asset_time_start
  end
end

File.open('no-asset-reusage.txt', 'w') do |file|
  time_map.sort_by(&:last).reverse.each do |user_id, seconds|
    file.puts "It took #{seconds} seconds to fetch assets for User with ID #{user_id}."
  end
  file.puts "It took #{Time.now.to_f - run_time_start} seconds for fetching all assets (without reusage)."
end

puts "DONE!"
I’m curious on what the output will look like 
EDIT:
Please make sure to get your system back in the state where we can reproduce the issue (Users assigned to Organization)
Okay, but I have to do that at the weekend. Otherwise my users will knock my head off me…
ok, i made the changes and executed the command. I loaded the files back into my GoogleDrive because they are very large.
Here again the link https://drive.google.com/drive/folders/1OLdKXG9_fV5XtFm91nxJa3ozh_RjB2iT?usp=sharing
Since there are no users logged in at the weekend, I logged in ten times for testing purposes and put 300 users into the organization to create some load.
You might have to mention @anon29869905 because he doesn’t seem to be getting email notifications for replies, not sure if he gets them for mentions either but won’t hurt.
Thanks @chesty and @anon28691334. I reviewed the provided files and they look good to me. The asset gathering takes 4.7 seconds after there is no cache at all. After the cacheable data was cached it took only 0.06 seconds! This is both far away from the 30 seconds we were talking about earlier. I think the system isn’t in the state where the error occurs anymore OR if it’s that fast on the weekend the system doesn’t scale when actively used. Maybe you should add some more CPU power to the machine?
hi @anon29869905 . please excuse the late reaction but due to some work I couldn’t answer earlier. I’ m going to monitor this for now. If the behavior occurs again, I immediately start the recording and post the data here. More CPU is an option I keep in mind. Thanks for the tip.
2 Likes
This topic was automatically closed 120 days after the last reply. New replies are no longer allowed.