Infos:
- Used Zammad version: 4.1.X
- Used Zammad installation type: Hosted Plus Account
- Operating system: Your System
- Browser + version: Chome Version 91.0.4472.124
Expected behavior:
- Grafana to use the elastic search Index to get the dashboard working
Actual behavior:
- Error Message
Steps to reproduce the behavior:
- Activate Elasticsearch in Zammad
- Setup Grafana und use Elastic search to get the indexes
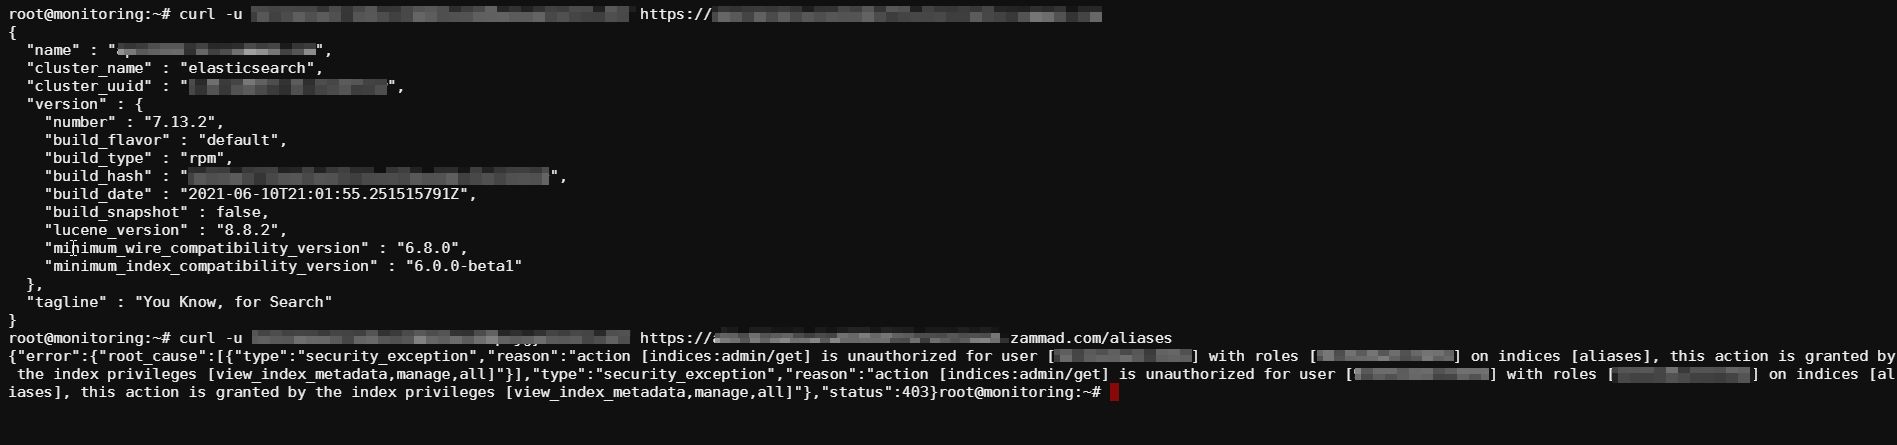
When I try to get the Indexes for the Dashboard running like in
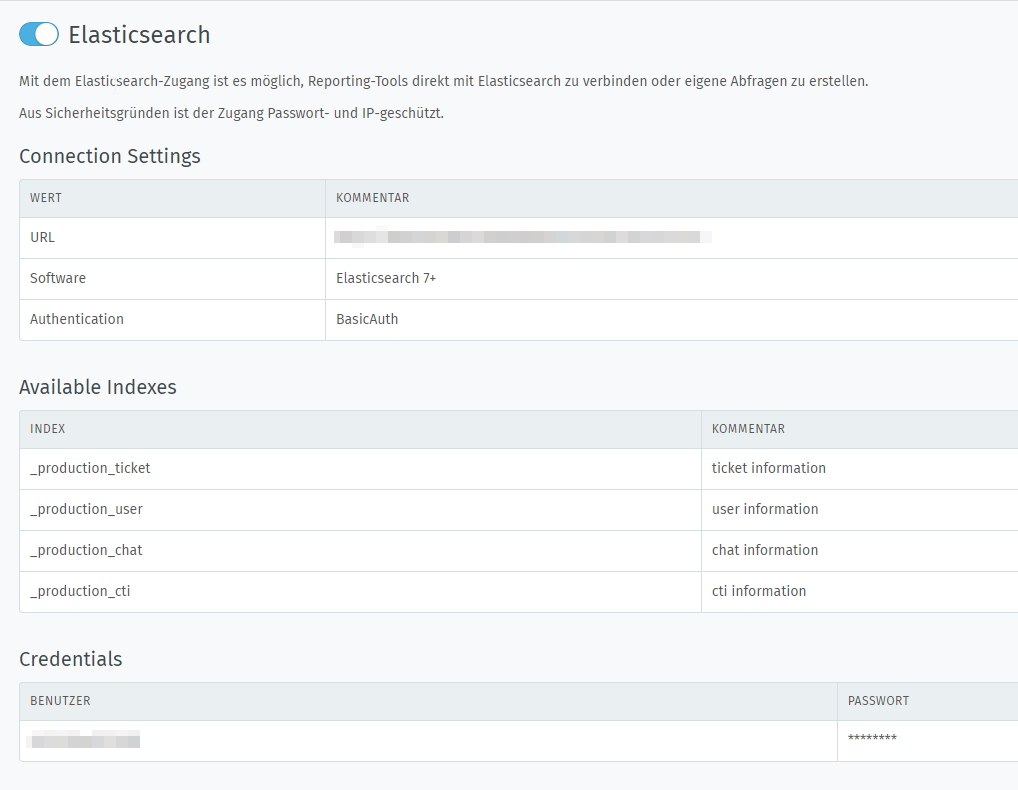
https://docs.zammad.org/en/latest/appendix/reporting-tools-thirdparty/grafana.html
I get an error message:

on Terminal the same:
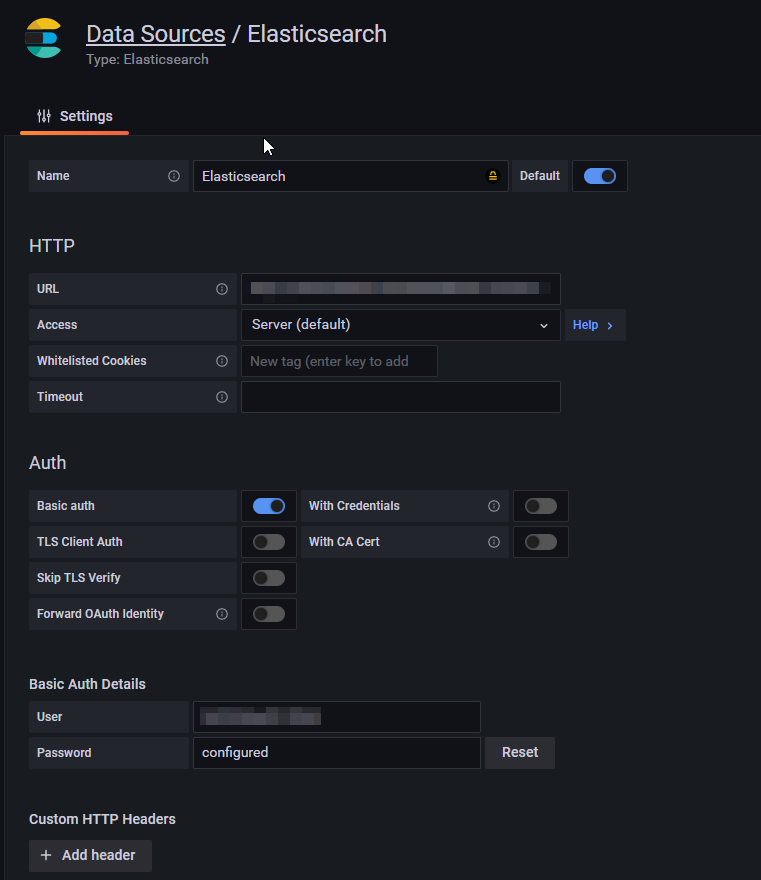
Everything is set up in Zammad Backend:
Did I missed something in the documentary or while setting up Grafana ?
I used Grafana as docker container but it looks like an error on the elasticsearch site.
Do I have to grant more permissions ?